


1. Introduction
In this paper we provide a framework actuaries can use to think about cyber risk. With the ambition of being fundamental, the paper tries to establish a distinct notion of “cyber” that can be associated with a set of characteristics relevant to conceptual as well as quantitative modeling of cyber risk. To that end, we identify and explain important factors that affect loss distributions after cyberattacks and, by extension, market participants’ decisions to offer or seek insurance for cyber risk. The paper reviews selected scholarly works that apply economic and actuarial concepts to the domain of cyber risk.
Understanding cyber risk is a hard problem. Standard textbooks on technical aspects of information security have many hundred pages in dense technical jargon and still cover each topic only superficially. Even seemingly simple security mechanisms used by billions of people every day are not fully understood. For example, according to Bonneau et al. (2012), a few hundred research papers address the problem of password security. The number of data points analyzed in these works accumulates to many millions. Yet the issue is far from being solved. Adding a risk perspective potentiates the problem space by including the combinatorics of technical, social, and economic factors. This paper provides a first step in structuring the field, by making it accessible to analysts trained in more conventional domains of risk modeling and highlighting the specifics of cyber risk.
Our approach is as follows. We first develop a definition of cyber risk useful for the insurance industry (Section 2). This involves recalling the key concepts of information technology and how they shape risk. Then we discuss the treatment of cyber risk from three relevant angles: cyber risk management by firms and organizations (Section 3), economic modeling of cyber risk transfer (Section 4), and actuarial modeling of cyber risk (Section 5). We close by discussing practical challenges to cyber risk insurance and promising research directions (Section 6).
The target audience of the paper comprises trained risk analysts and actuaries in the insurance industry. Some aspects may also be relevant for underwriters, brokers, corporate risk and information security managers, policy analysts, and academics studying related fields. This paper addresses topics with global scope. Therefore we refrain from making policy recommendations that would be specific to a few jurisdictions.
2. Cyber risk
Undoubtedly, the term cyber has become a buzzword among marketers and policymakers, causing a plethora of associations but lacking a single unanimous definition. The application of the term cyber is vast, from the “cyberspace” popularized after the science fiction short story collection Burning Chrome (Gibson 1987) to the establishment of the United States Cyber Command in 2010. The latter is a consequence of recognizing cyber to be the fifth domain of warfare next to land, sea, air, and space (Lynn 2010). What matters from a risk and insurance perspective is whether the qualifier “cyber,” for instance in cybercrime, is merely an exchangeable technology prefix, such as “electronic” (or shorthand “e”) in electronic commerce, or if it can meaningfully demarcate cyber risk as a new class of risk that requires special treatment and tailored conceptual models.
2.1. Technological context
To distinguish cyber from non-cyber (or conventional as a qualifier for risk and insurance), it is helpful to recall key characteristics of the enabling technology. All advances in information technology result from progress in microchip manufacturing, chiefly the technical capability to densely integrate electrical circuits in mass production, along with the engineering tools to design circuits with millions of logical elements (gates) in a systematic and largely predictable manner. The design complexity of circuits hints at the first source of risk. The number of possible states of a few hundred gates exceeds the number of atoms in the known universe, and the relation between inputs, states, and outputs of circuits can be highly nonlinear. Therefore it is impractical to test and fully predict the behavior of arbitrary circuits built with current technology even if their design is known.[1]
Microchip production is characterized by substantial economies of scale. Creating the tool (a set of masks) to produce the first batch of a circuit is very expensive; the cost for every following batch is negligible compared to the upfront cost. The industry has adapted to this cost structure. It mainly produces general purpose circuits, programmable to control many different applications. This highlights the crucial role of software in determining the behavior of most electronic devices. Take for instance electronic elevator control units. In the 1970s, these devices were built solely for this purpose and designed with exactly the components needed to realize the required logic. The resulting circuits were complicated, but it was possible for a trained expert to understand the system completely. The design complexity still allowed for analysis of error sources in case of incidents and possibly inference about causes and effects. Understanding these relations is essential for risk analysis and the attribution of losses. Modern control units are built from general purpose microprocessors, which densely integrate zillions of electronic components. The behavior of such systems is defined by customized software that implements the required logic and often uses only a small fraction of the functionality offered by the general purpose component. The resulting systems exhibit high design complexity. This increases the risk that design flaws remain unnoticed and raises the effort of proactive risk research as well as the cost of forensic analysis after incidents. Both add to uncertainty and raise the transaction costs of risk transfer arrangements.
These are not the only issues software systems cause from an insurance perspective. It is easier to revise software than to upgrade hardware (Shapiro and Varian 1998). This leads to short product life cycles and consequently less time to collect actuarial data for a system in operation. Possibly most worrying is that some classes of common programming errors allow malicious third parties to reprogram the logic of a device. As many devices are overequipped for their purpose, the existence of hidden functionality is often hard to detect because the modified device still behaves as expected. We have witnessed such hostile takeovers in the form of computer viruses on personal computers and malware infections on smartphones. The Stuxnet worm (Chen 2010), as an early example of state-sponsored cyber warfare, highlights that programmable devices in industrial control systems are not exempt. With the proliferation of programmable devices in every aspect of life—typically referred to as the Internet of things—it is only a matter of time until cybercriminals enter these platforms.
The ongoing connection of programmable devices to networks with wired or wireless physical links leverages the risk to be considered by insurers mainly through two channels. First, compound systems consisting of many interconnected microprocessors, often owned and controlled by different parties, exhibit additional design complexity. In many cases no entity has a global plan or view of the overall system, rendering validation and prediction very hard or impossible. Second, networking increases the surface for and reach of malicious attacks. While modifying the software of standalone devices requires physical proximity at least once in the life cycle (including the supply chain), networked devices, if not sufficiently secured, can be reprogrammed remotely from any other device in the network. Consequently, devices connected to the Internet, an internetwork designed for routing data packets globally, are in principle exposed to threats from any other person with access to the Internet.
Networked systems further complicate risk analysis because insurers are rarely in the position of insuring a network as a whole. Instead, different parts of the network (nodes) are operated by autonomous decision makers (agents), each with different interests (utility functions), information sets (information asymmetries), and expectations. They make independent economic decisions while being connected by a common factor that affects the joint outcome (externalities). Part of the agents’ decision space is whether to invest in security (risk mitigation) or buy insurance (risk transfer).[2] The economic terms in parentheses suggest that cyber risk analysis is as much about understanding and modeling the technology as it is about understanding and modeling the economic incentives of the involved agents (Anderson and Moore 2006).
But technological advances also yield new opportunities for insurers. This generation is about to witness a digital revolution because the very same technology opens a large space for innovation, often with the potential of unleashing unprecedented economic growth (e.g., Brynjolfsson and Hitt 2003). To continue the previous example, the microprocessor powering a digital elevator control has spare capacity to solve more complicated logic. For instance, it could be programmed to predict demand or to coordinate with a second elevator in the same building—functions that are typically marketed with the keyword smart. Other examples of recent innovations, such as autonomous vehicles, would not be possible without microprocessors and networks that supply relevant data on request (e.g., traffic information). As a result of these and similar developments across many industrial sectors, businesses, households, and governments increasingly depend on information technology in numerous ways (Brynjolfsson, Hitt, and Yang 2002). However, what is a center of value creation turns into a loss center at the moment the technology fails to serve its purpose. This allows insurers to offer coverage for technology and assets that depend on it.
2.2. Defining cyber risk
We have used the term risk informally in the previous section. For our definition of cyber risk, it is convenient to start with a high-level notion of conventional risk inspired by the management literature (e.g., Kaplan and Garrick 1981):
Risk = Probability of a loss event × Magnitude of the loss
This definition of risk has many deficits. It coerces a complicated loss distribution to a single Bernoulli trial, is agnostic about the time dimension, and does not differentiate between individual and aggregated losses caused by a single loss event. Yet this definition is useful to motivate a differentiation that helps to develop a more precise notion of cyber risk than commonly used. We propose to distinguish between
-
risk arrival, the processes causing loss events, modeled in the simplest possible form as probability of a loss event in equation (1), and
-
target, the assets that suffer losses, modeled as a fixed magnitude of loss in equation (1).
Both risk arrival and target can independently belong to one of the two classes: cyber or conventional. We classify risk arrival as cyber if the loss event is primarily caused by logic (and, by extension, computer programs and networks) and as conventional if the loss event is primarily caused by physical force. Likewise, we speak of a cyber target if the loss event predominantly devalues information assets, such as, for example, through destruction (data loss or unauthorized modification), loss of exclusivity (data breach), and consequences thereof (data abuse). A conventional target incurs losses by the destruction or unavailability of physical assets. Borderline cases exist along both dimensions. However, we believe that this distinction is useful—for instance, because insurers can implement a modular approach with division of labor: one team specializes on the specifics of cyber at the risk arrival process; another team of experts valuates cyber assets and quantifies losses. With this distinction, we can precisely classify all cyber incidents proposed in Box 1.
We have collected alternative definitions of cyber risk to cross-check our definition. Most authors agree that the involvement of networked computers is an essential element (cf. Öğüt, Raghunathan, and Menon 2011; Böhme and Schwartz 2010). Among the more specific definitions, we observe that some emphasize the cyber element in the arrival process (cf. Anderson et al. 2008; Mukhopadhyay et al. 2013; Stoneburner, Goguen, and Feringa 2002), whereas others focus on cyber targets (cf. Biener, Eling, and Wirfs 2015; Cebula, Popeck, and Young 2010; ISO/IEC (International Organization for Standardization/International Electrotechnical Commission) 2014; Eling and Schnell 2016). This observation confirms our belief that a unified definition should include both aspects and weigh them equally.
Our approach is compatible with conventions in the literature to classify cybercrimes by the role of computers and networks in criminal acts (cf. Goodman 1997; Alkaabi et al. 2011). Computers and networks can be targets, facilitating tools, or incidental aspects of crimes. The third category is dropped in recent definitions of cybercrime since the ubiquity of the Internet makes computer networks an incidental aspect of almost any crime.
We have also considered alternative distinctions, such as the difference between tangible and intangible losses or the difference between random failures and malicious attacks. As these attributes are known for conventional insurance and do not characterize the specifics of cyber risk, we consider them as conceptually orthogonal to our distinction by the domain of risk arrival and target.
2.3. Insuring cyber risk
Cyber insurance is a vehicle for cyber risk transfer. In exchange for a defined premium and for a defined period of time, the insurer contractually agrees to financially compensate potential losses incurred by the insured through the realization of cyber risk. Like in conventional insurance, losses may comprise primary and secondary losses (the sum of which is referred to as recovery cost) and the indemnity may include first-party as well as third-party losses for which the insured is held liable (Anderson et al. 2008, 82). Box 2 summarizes the state of the cyber insurance market at the time of writing.
Using the definition of cyber risk from Section 2.2, we differentiate between three forms of cyber insurance as illustrated in Figure 1. The figure tabulates the domains of risk arrival in rows and the domains of the target in columns. Conventional (non-life) insurance is located in the top left area. Cyber insurance in a narrow sense is located in the bottom right area. This is what most authors of early contemplations of cyber insurance presumably had in mind (e.g., Medvinsky, Lai, and Neuman 1994; Schneier 2001; Grzebiela 2002; Baer 2003).

Several reasons explain why the market for cyber insurance in a narrow sense did not evolve as predicted, chiefly a lack of demand and a lack of claims in the 1990s. The lack of claims was interpreted as an indication of cumulated risk. This spurred fears of a “cyber hurricane,” which led reinsurers to stop covering cyber risk in the early 2000s (Böhme and Schwartz 2010). Although the market did not evolve as predicted, nascent markets for cyber-threat and cyber-asset insurance exist.
The increasing demand for cyber-asset insurance, in the top right corner of Figure 1, is a consequence of the growing dependence of organizations on information systems and the data processed therein. Although some industry experts initially saw difficulties in writing precise policies for the intangible losses of information assets, the progress made in valuating intangible assets in the finance and accounting disciplines has accommodated this concern. A major development to this end is the uptake of marketplaces for information technology services (e.g., in various cloud computing models) and for business data (Balazinska, Howe, and Suciu 2011; WEF (World Economic Forum) 2011). Both market types generate price information useful for estimating the monetary value of (lost) in-house infrastructure or databases. Another avenue for the insurance industry to get in touch with cyber risk is the bottom left corner of Figure 1, provisionally termed cyber-threat insurance. Although cyberattacks are commonly excluded from property or liability insurance, insurers and reinsurers begin to realize that they might be exposed to cyber threats indirectly through business interruption policies. Networked information technology has become so vital, in particular for operations and the supply chain, that computer networks are an incidental aspect of almost every business interruption. Policies with explicit exclusions of cyber will therefore become harder to sell. We observe a trend that exclusions will be defined more narrowly—such as, for instance, specifically naming acts of cyber warfare or cyberterrorism—and combined with a tight limit on the order of $50 million for incidental cyber risk not belonging to the specified categories. This also limits the exposure if an act of cyber warfare cannot be attributed unanimously to a nation state (Clarke and Knake 2012), a situation experienced with the Sony hack in 2014.[3]
Another line of business is cyber insurance of third-party risk. In that case policyholders are held liable for monetary amounts that can be passed on to the insurer. This partly explains the success of insurance policies covering losses from breach-reporting obligations (Romanosky 2013; Kirkpatrick 2015; Laube and Böhme 2016; Bandyopadhyay, Mookerjee, and Rao 2009). Corresponding legislation is high on the policy agenda around the globe in order to reduce underreporting of cyberattacks. However, important limitations remain. Most policies cover only parts of the costs, define rather tight limits on each loss source, and exclude losses of reputation and subsequent negative stock market reactions, which are hardly measurable (Acquisti, Friedman, and Telang 2006). Moreover, insuring against regulatory fines is prohibited in many jurisdictions (Gatzlaff 2012). If quantifying losses ex post is difficult, insurer and policyholder may agree on a fixed indemnity ex ante, provided that the agreement complies with the codification of the indemnity principle in the jurisdictions concerned.[4]
3. Cyber risk management
To insure cyber risks, insurers must be able to identify essential risk factors and understand the decision of firms to seek insurance for specific risks.[5] To provide a fundamental background, this section describes risk factors using the typical chain of causality from cyber threats to financial losses, and recollects selected aspects of how firms implement information security in practice.
3.1. Risk factors
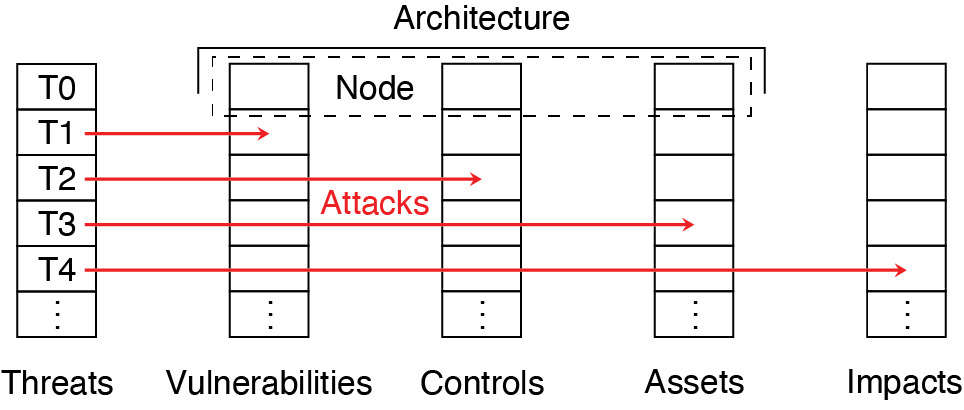
We conceptualize a cascade model of cyber risk arrival, depicted in Figure 2, to organize five classes of risk factors: threats, vulnerabilities, controls, assets, and impacts. Our model is tailored to the scope of this article. For a more comprehensive path model, see Ransbotham and Mitra (2009).
3.1.1. Threats
Threats subsume accidental physical or logical errors and intentional action by malicious attackers. Our model defines threats as the root causes of loss events, although it is possible in principle to dig deeper. As cybercrime became a profit-driven industry in the early 2000s (Anderson et al. 2008), scholars have started to analyze the motivations of attackers drawing on criminology (Cressey 1953) or the economics of crime (Becker 1974). Attackers use various methods including technical means, such as malformed network packets, nontechnical scams, such as social engineering to obtain access credentials, or a combination of both.
The conservative assumption that attackers always choose the weakest link has almost become a mantra in security trainings. A more precise model is to broadly classify attack strategies by their relation to victims (Herley 2014). Opportunistic attackers do not care about whom they attack. They standardize attack techniques to enjoy economies of scale when hitting several targets, of which only a small fraction gets victimized. Unsolicited mass e-mail (spam) is an example for this strategy. By contrast, targeted attacks focus on a specific victim and customize the attack method. They often involve several iterations of information gathering, with the aim to maximize the success probability against a carefully selected target. This strategy pays off for high-value targets, such as in extortion and industrial espionage. An important implication for risk analysis is that modeling threats as probabilistic is more appropriate for opportunistic attackers than for targeted attacks. More adequate analytical tools for the latter are worst-case approximations and game theory.
3.1.2. Vulnerabilities
Not every threat realizes a risk. Threats require vulnerabilities in the target system to become successful attacks. To continue the examples from above, the malformed network packet is harmful only if the software processing the data packet enters an undefined state that allows the attacker to take over control.[6] Such vulnerabilities emerge from common programming mistakes, which are hard to be fully avoided in the software development process. Likewise, the social engineering attempt is successful only if the victim is tricked into sharing credentials with unauthorized parties. With respect to Bandyopadhyay, Mookerjee, and Rao (2009), we may distinguish between symptomatic and systemic vulnerabilities. The former affect only a single firm (e.g., because it uses custom software or runs an erroneous configuration) whereas the latter exists in many firms (e.g., when standard software is vulnerable or a default password has not been changed).
Technical vulnerabilities matter for risk analysis in two ways. First, systemic vulnerabilities expose many targets to the same threat. With the ability to scale attacks by automating them on programmable devices and using networks as propagation vectors (cf. Section 2.1), many firms are at risk of suffering losses at the same time. This correlation between risks leads to fatter tails of the cumulated loss distribution and may hamper insurability (Böhme and Kataria 2006). Second, information about vulnerabilities is notoriously incomplete, leading to a race for information between attackers and defenders (Ransbotham, Mitra, and Ramsey 2012). There is some controversy about the right regime of distributing vulnerability information between stakeholders. Some consider vulnerabilities a strategic asset for national security (Moore, Friedman, and Procaccia 2010), others a tradable information good (Böhme 2006). The distribution regime affects the vulnerability discovery process by setting incentives for security researchers. It may also affect vendors’ efforts to produce software with fewer vulnerabilities and distribute patches. In practice, many disclosure regimes coexist, with underground markets on one end of the spectrum and organizations committed to responsible disclosure on the other end (Miller 2007; Arora, Telang, and Xu 2008; Zhao, Grossklags, and Liu 2015). Given the decisive role of vulnerability information, the insurance industry will likely take part in the vulnerability ecosystem when it covers substantial amounts of cyber risk.
3.1.3. Controls
Not every pair of threat and vulnerability leads to a successful attack. Firms can place technical and nontechnical controls to mitigate cyber risks. Awareness campaigns and trainings for employees are examples of nontechnical means. Technical controls can be detective controls, which indicate the realization of threats, possibly trigger alarms, and require reaction, or preventive controls, which proactively shield specific vulnerabilities from threats (cf. Cavusoglu, Mishra, and Raghunathan 2004). Regarding preventive controls, most people think of add-ons, such as network packet filters or antivirus software. However, structural changes, such as dedicated networks for critical data disconnected by “air gaps,” are preventive controls, too. All controls cause costs that firms must weigh against the expected benefit in terms of prevented losses. Many scholars have studied this decision problem through the lens of investment theory (cf. Hoo 2002; Gordon and Loeb 2002; Su 2006; Böhme 2010). The management of controls often requires strategic decisions, such as prescribing minimum access rights to information or specifying a patch strategy. In the latter case firms face a trade-off between fast rollout of software updates to close known vulnerabilities and the risk that barely tested patches have unanticipated side-effects or break critical business processes (Beattie et al. 2002; Ioannidis, Pym, and Williams 2012).
All types of controls are relevant for risk analysis. Detective controls improve information and provide a more direct access to data on the risk arrival process than counting (aggregated) losses. Preventive controls mitigate the risk of specific threats.
3.1.4. Assets
The interaction between threats, vulnerabilities, and controls determines the success of attacks. Attacks turn into incidents if they hit critical assets. It is not necessary that the asset is damaged or destroyed; a customer database leaked to outsiders may be as painful as losing it entirely. In general, any undesired breach of a canonical protection goal (confidentiality, integrity, availability) is considered a security incident. Including assets as an individual risk factor is important because firms may use similar technology to secure assets of very different value and sensitivity. To illustrate this, recall that the technology behind secure Internet connections, the HTTPS protocol, does not substantially differ between online banks and well-administered websites of online pizza shops.[7]
For actuaries the valuation of assets (as discussed in Section 2.3 in the context of cyber-threat insurance) is an essential prerequisite to the estimation of expected losses if any of the different protection goals is violated.
3.1.5. Impacts
The value and criticality of affected assets influences the potential impact of an incident and thus the amount claimed under an insurance policy. The impact may exceed the asset value by orders of magnitude—for instance, a firm that stores customers’ passwords in plaintext[8] may face substantial liability and compliance cost along with severe reputation damage if a breach exposes customer data to the public. The impact can also be just a fraction of the asset’s value, if an effective incident response and recovery prevent larger damage. Insurers may provide professional incident response services for their policyholders to reduce impacts (AGCS (Allianz Global Corporate & Specialty) 2015).
3.2. Determinants of risk factors
We have introduced the cascade model in order to structure the factors to be considered when modeling cyber risk arrival and loss distributions for different targets. The model also allows a risk analyst to reason on what drives these factors. Most experts will accept threats as exogenous or environmental factors although, in principle, policy or industry initiatives can try to tame the threat environment (Asghari, Ciere, and van Eeten 2015). In general, threats follow global trends in the long run, and attacker tactics in the short run.
By contrast, vulnerabilities, controls, and assets are predominantly endogenous factors—that is, firms can in principle control them. These three factors together constitute a firm’s information architecture (as annotated in Figure 2). However, not every firm can exercise direct control on all three factors. Many vulnerabilities originate in software or components supplied by external vendors. With high concentration in software markets and the aim for standardization and interoperability, many firms have little choice about this part of their architecture (cf. Carr 2003). Similarly, the type and value of assets largely depend on the firm’s business, size, and level of technology adoption. By contrast, controls are largely in the responsibility of individual firms. Therefore risk analysis must consider security investments as a relevant determinant of cyber risk. Because firms decide strategically on their security investment, insurers need to understand firms’ incentives in order to prevent adverse selection and moral hazard (see Sections 4.3.1 and 4.3.2 below).
Firms cannot always control the impacts of a successful attack. While plaintext passwords in the example above could have been avoided with the right controls, it is easy to find examples where the impact is driven exogenously. A breach may lead to more adverse public reaction if a firm is the first or the only one affected in an industry. Postbreach crisis communication and incident response may matter a lot. For example, an industry report estimates the cost of data breaches per record between a few cents and $1.6 million (NetDiligence 2016). The orders-of-magnitude difference hints at the imponderables with this type of risk. A particular challenge for modeling the impact of privacy breaches is that sensitive information often results from joining leaked records with other public or proprietary databases available at the time of the breach or in the future (Sweeney 2002; Narayanan and Shmatikov 2008). The likelihood and consequences of such events are very hard to predict.
3.3. Cyber risk management in practice
From an insurance perspective it is important to understand how (well) firms manage cyber risks and where to find such information. Firms synthesize the canonical instruments from general risk management and IT security to conduct cyber risk management. Cyber risk management requires the definition of a security policy, which guides a firm’s information security operations. This, in turn, is centered around the problem of managing and enforcing authorization decisions in a systematic and efficient manner.
Approaches to embed risk management in the organizational structure of firms range from a single centralized department to delegated officers in each business unit. Intermediate forms also exist. The key roles that enable cyber risk management are (1) the senior management, approving an organization’s security policy; (2) the chief information security officer (CISO), as the person in charge of a firm’s cyber security; and (3) security specialists (often embedded in IT operations), carrying out security-related tasks (Stoneburner, Goguen, and Feringa 2002). Issues may arise if the CISO does not have direct access to the senior management, or if a source of cyber risk is located outside of the officer’s area of influence.
Several standards support risk management in organizations. They can roughly be divided into two classes: top down (focusing on the risk management process) and bottom up (focusing on identification and quantification of individual risks). A prominent example of the former category is the ISO 27000 series (ISO/IEC (International Organization for Standardization/International Electrotechnical Commission) 2014), adopted by many large firms across different sectors (PricewaterhouseCoopers 2016). The OCTAVE methodology is an example for the latter (Caralli et al. 2007). Moreover, industry-specific standards, such as the Payment Card Industry Data Security Standard (PCI-DSS), certify compliance with defined practices (PCI Security Standards Council 2015). From an insurance perspective, standards and certifications of firms are indicators of good security practices. However, industry experts complain that many standards and certifications are incoherent and compliance with them is a weak predictor of actual security. For instance, the retailer Target was certified to be PCI compliant just before being hit by a major breach.[9] Furthermore, voluntary certifications provide weak signals because they may suffer from adverse selection: less secure firms have stronger incentives to seek certification (Edelman 2011).
4. Economic modeling
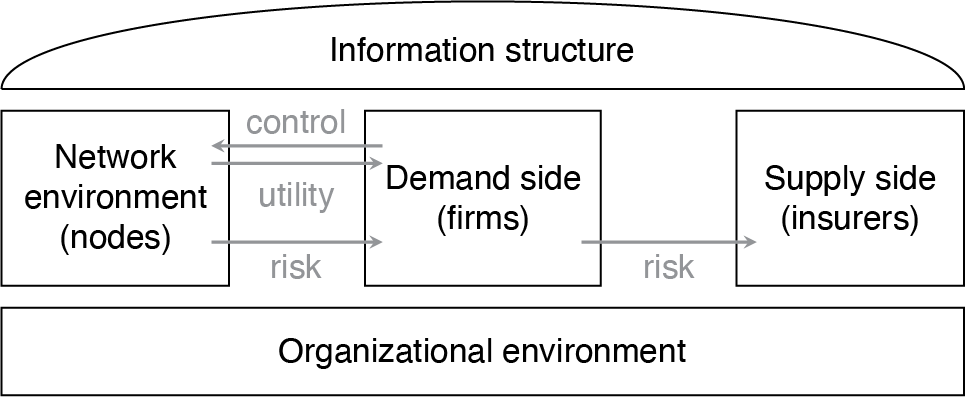
Most economic models of cyber risk insurance analyze whether and under what conditions markets for cyber risk insurance can exist. This depends on the properties of the loss distribution and the actions of all market participants involved. We adapt the framework of Böhme and Schwartz (2010), depicted in Figure 3, to structure the action space of all involved parties.
.png)
4.1. Framework
The framework has two natural components, which correspond to the demand and supply side of insurance markets. The specific characteristics of cyber risk are modeled by the component called network environment. The network environment is composed of atomic but connected elements called nodes. Generally, firms control nodes to extract utility from the network. As a side effect, they are exposed to risk that arrives as described by the cascade model of Section 3.1. It is convenient to assume that each node represents exactly one cascade of risk factors (as annotated in Figure 2). Firms control many nodes, interconnected by physical, logical, and social links, such as trust relationships. The links between nodes are typically represented as edges of graph structures.
An obvious example of cyber risk dependencies in a network environment is the propagation of malware, which infects several networked computers (nodes). However, risks can also arise in the software engineering process, as the security of a software product depends on all individual components. From this perspective connected nodes can model single points of failure due to vulnerabilities in common components or dependence on a single external supplier, for instance, a cloud service provider. Risks can also propagate in systems of an interconnected supply chain or, from the social perspective, by sharing confidential information with business partners.
This list of dependence relationships is clearly not exhaustive and each type of relationship is characterized by a specific graph topology (see Figure 4). Conceptually, every real-world insurance policy bundles the risk exposure of many nodes—typically those controlled by the policyholder, or a subset if exclusions apply. These nodes possibly maintain connections to nodes under the control of other firms. This assumption naturally generalizes the model to a setting with interdependent security, a specific type of externality discussed later in Section 4.4.

The known issues of insurance markets related to information asymmetries—in particular, adverse selection and moral hazard—can be incorporated by instantiating another component of the framework called information structure. Information on cyber risk is inherently asymmetric. The complexity alluded to in Section 2.1 precludes even the vendors of programmable components from fully predicting their behavior when combined in practical systems. The information structure bundles modeling decisions that affect the distribution of information (including remaining uncertainty) about the state of the world among the economic agents.
The last component, organizational environment, defines general rules. It comprises all parties who can intervene with the cyber insurance market although they do not directly appear on the demand or supply side. In a model world where market participants follow rational choice, possible interventions take the form of adjusting incentive structures such that a desirable social outcome becomes more likely. An example is regulators’ introduction of breach notification laws to incentivize security investments at firms.
4.2. Common assumptions
Most economic models emphasize the risk arrival process in a single time period short enough to neglect discounting. A common assumption is to model the loss as binary outcome: either the firm faces a loss of fixed size l > 0 or no loss at all. The loss amount l is measured on a monetary scale. This reduces the target dimension of cyber risk to a Bernoulli random variable L ∼ B(1, p) • l, where B(n, p) is the binomial distribution parameterized by the number of controlled nodes n and the probability of loss p. Values of n > 1 are reserved for situations where firms control multiple nodes, often in combination with variants of the binomial distribution where trials are not independent.
With n = 1 and l fixed,[10] the only way to model control over the risk exposure is to let a firm’s probability of loss p depend on its risk mitigation efforts. This leads to a monotonically decreasing defense function mapping a monetary security investment s to a probability of loss p.[11] A simple defense function is given by
p=D(s)=β−s,
where β > 0 is a parameter of security productivity. It controls how efficient money spent on security controls can prevent threats from materializing as successful attacks. More complicated forms of defense functions can be found in the seminal literature on information security investment (Gordon and Loeb 2002). Most defense functions are convex, suggesting an interpretation of decreasing marginal benefit of security investment. The rational choice paradigm predicts that firms maximize their expected wealth by choosing the security investment level s* ≤ l, which minimizes the sum of expected losses and the associated cost of controls s:
s∗=argmins(D(s)⋅l+s).
This equation models the optimal decision for risk neutral firms. Insurance markets can exist only if firms are risk averse, meaning that they are willing to trade expected wealth for reduced variance. Economists model risk aversion with concave utility functions[12] Uσ: ℝ → ℝ, which map monetary wealth to preference scores (Pratt 1964). Parameter σ > 0 controls the strength of the risk aversion. Firms’ preferences are ranked by expected utility—which differs from the utility of the expected wealth—and the utility has to be computed over the total wealth including security investment. Risk-averse firms optimize the following problem:
s∗σ=argmaxs(E[Uσ(Ws)]),
where Ws is a random variable of the firm’s final wealth given security investment s, and E[•] is the expected value operator. For the simple Bernoulli loss model and initial wealth w, we obtain
s_{\sigma}^{*}=\arg \max _{s}\binom{D(s) \cdot \underbrace{U_{\sigma}(w-l-s)}_{\text {bad case: loss }}}{+(1-D(s)) \cdot \underbrace{U_{\sigma}(w-s)}_{\text {good case }}} . \tag{5}
Market insurance can be modeled by allowing firms to buy insurance for losses up to a limit x at the price of a linear premium π • x. In the Bernoulli loss model and respecting the indemnity principle, it must hold that x ≤ l. With optional market insurance, firms optimize their action in the (s, x) plane:[13]
(s, x)_{\sigma}^{*}=\arg \max _{s, x}\binom{D(s) \cdot U_{\sigma}(w-l-s+(1-\pi) \cdot x)}{+(1-D(s)) \cdot U_{\sigma}(w-s-\pi \cdot x)} . \tag{6}
Insurers can offer this policy only if they have complete information and all firms are homogenous. In this case, insurers anticipate firms’ choices and adjust π to reflect the risk given the common security investment s*:
\pi=D\left(s^{*}\right) \cdot(1+\lambda) \tag{7}
where λ is a loading needed to pay administrative costs, the cost of safety capital, and insurer’s profit. A premium is called actuarially fair if λ = 0, which implies full insurance (s, x)σ* = (0, l).[14] It also highlights that insurance and security investment are substitutes in this model. In practice, actuarially fair premiums are only sustainable with subsidies.[15] If λ > 0, the existence of an insurance market (i.e., xσ* > 0) depends on the strength of risk aversion σ and the shape of the defense function D. In general, higher loadings λ require more risk-averse firms (σ) and less effective risk mitigation (β) for an insurance market to exist.
4.3. Information asymmetries
In practice, firms are not homogeneous. Each firm i has an individual level of initial wealth wi, risk aversion σi, and a defense function Di.[16] Consequently, each firm finds a different optimal action (si, xi)σ* from solving equation (6). Information asymmetries arise because individual actions are not easily observable.
4.3.1. Adverse selection
Adverse selection occurs before an insurance contract is signed. The insurer faces the problem of finding the right premium π. For all choices of λ reasonable in the homogenous case, any choice of π in
\min _{i}\left(D_{i}\left(s_{i}^{*}\right) \cdot(1+\lambda)\right)<\pi<\max _{i}\left(D_{i}\left(s_{i}^{*}\right) \cdot(1+\lambda)\right) \tag{8}
leads to an adverse selection problem (Rothschild and Stiglitz 1976). Firms can be divided in good risks, where π is high enough for the insurer to pay losses and profit, and bad risks, where π is too low for the individual probability of loss. Since the decision to seek insurance is made by rational firms, bad risks will seek (disproportionally more) insurance whereas good risks substitute insurance with security investment or risk acceptance. The resulting portfolio becomes a loss source for the insurer.[17] The canonical response against adverse selection is premium differentiation. In the best case, individual premiums πi can be adjusted to the individual risk Di(si*), where si* may be anticipated. To simplify analytical models, D is often fixed for all firms, an assumption justifiable by the use of commodity technology (Carr 2003). This allows the insurer to offer a menu of bundles (sk, πk), such that each firm i chooses and commits to a security investment sk in exchange for receiving coverage of the residual risk at premium πk. In practice, security investment and actual security level are not perfectly aligned. Therefore, insurers have to resort to approximations of sk by evaluating indicators on the firm’s technical and nontechnical risk management practices.
4.3.2. Moral hazard
Moral hazard occurs if the insurer cannot monitor policyholders’ contractual behavior. Once a firm has bought coverage x = l at premium πj • x, it can profit from reducing its security investment to a value s sk below the agreed level. If the insurer cannot observe the contract violation, it faces losses. Schwartz and Sastry (2014) note that insurers can tolerate only a limited share of such “malicious” policyholders in their portfolio.
Moral hazard can be dealt with by vigilant contract monitoring, possibly involving intermediaries such as technical auditors. Since cyber risk analysis is a complex and barely standardized task, the transaction costs caused by contract monitoring are rather high and might render certain types of insurance uneconomical. Another way to limit moral hazard is to employ deductibles, which technically define an upper bound for x ≤ xmax l. The deductible l − xmax helps to better align the incentives of policyholders with the interest of the insurer (and by extension all policyholders in its pool).
4.3.3. Insurance fraud
Insurance fraud occurs at the time of indemnification. Analyzing causal relationships, attributing losses to events, and verifying insurance policy conditions in (re-)programmable networked systems is a complex and time-consuming task. Digital forensics are in principle mature enough to provide reliable results after outside attacks. Nevertheless, ambiguities remain for technical and political reasons—the latter if the attack involves a state actor and diplomatic relations are concerned. Digital forensics reaches its limits if an inside attacker falsifies traces or plants misleading evidence (Böhme et al. 2009). This may open a window of opportunity for fraudsters to overstate losses until the levels of insurers’ fraud prevention and detection systems in the claims management processes are comparable to those in conventional insurance. The opposite situation, where policyholders forgo a fraction of the loss that they cannot substantiate, acts as a barrier to the development of insurance markets (Öğüt, Raghunathan, and Menon 2011).
4.4. Interdependent security
Whereas adverse selection and moral hazard are known and understood in conventional insurance, interdependent security is highly specific to the nature of cyber risk.[18] Interdependent security is a special kind of externality best modeled by modifying the defense function: for each node in a network, the probability of a loss depends not only on its own security (controls) but also on the security of all connected nodes. To illustrate this point, recall that the much-quoted Target data breach in late 2013 was caused by a security hole at one of its suppliers.
4.4.1. Model and example
Taking this to the level of firms in our economic model, the modified defense function I with interdependent security takes as arguments the investment of all connected firms:
p_{i}=I\left(\left(s_{1}, \ldots, s_{n}\right), g, i\right)=1-\prod_{j=1}^{n}\left(1-g_{i, j} \cdot D\left(s_{j}\right)\right) \text {. } \tag{9}
In this specification, n is the number of firms and g is an n × n adjacency matrix of a (possibly directed) graph describing the first-order dependence between the nodes controlled by the firms. The matrix can hold binary values for all-or-nothing dependence or values between zero and one to weigh the importance of links. We require that gii = 1 ∀i to generalize the case without interdependent security. Function I replaces D in equations (5), (6), and (7).
To study the implication of interdependent security, it is convenient to regard symmetric interdependence between two firms 1 and 2 only. We obtain
p_{1}=I\left(s_{1}, s_{2}, \alpha\right)=1-\left(\left(1-D\left(s_{1}\right)\right)\left(1-\alpha \cdot D\left(s_{2}\right)\right)\right) \text {, and } \tag{10}
p_{2}=I\left(s_{2}, s_{1}, \alpha\right)=1-\left(\left(1-D\left(s_{2}\right)\right)\left(1-\alpha \cdot D\left(s_{1}\right)\right)\right) \text {, } \tag{11}
where α ]0, 1] is the degree of interdependence corresponding to the values in g1,2 and g2,1 of the general model. Without loss of generality we restrict the security investment to si {1, 2}, assume the security productivity β = ½, initial wealth w = 3, and the loss l = 4. Table 1 shows the payoffs of a matrix game between both firms deciding on security investment without the option to seek market insurance as a function of α.[19]
For any degree of interdependence α > 0, the only pure strategy Nash equilibrium is (s1, s2) = (1, 1)—both firms invest little in security—because no firm can improve its payoff by unilaterally switching to si = 2. However, the social optimum of this game is (s1, s2) = (2, 2)—both firms invest much in security. This indicates a classical prisoner’s dilemma. In other words, if networked firms secure their nodes, interdependent nodes may free-ride on their efforts. As a result, no single party wants to contribute to the network security, which exhibits characteristics of a public good in this kind of model.
4.4.2. Implications
Interdependent security has two important implications for insurers. First, insurers not only face the difficulty of measuring and monitoring the security practices and exposure of their policyholders. To precisely model the risk arrival, they also need to collect information about the security of interconnected nodes. These may be owned and operated by parties without contractual relationship with the insurer, possibly residing in different jurisdictions. In the absence of this information, insurers must resort to conservative approximations. They may at least consider including the number of incoming edges and indicators about the degree of interdependence in the premium calculation.
Second, insurers may provide the social coordination mechanism to resolve this instance of the prisoner’s dilemma. If the insurer can observe firms’ security effort, it can (and should) design a pricing scheme that incentivizes security investment at the social optimum. This is in the best interest of all policyholders and leads to welfare improvements beyond what is achievable with risk pooling in conventional insurance lines. This idea is a strong argument for bootstrapping a deep market for cyber risk insurance, possibly with the help of subsidies justifiable with the provision of a public good. However, important limitations remain. There may be free-riders that do not buy insurance. They enjoy the benefits of the public good while having no incentive to contribute. Another issue is competition in the insurance market. A monopolist is in the best position to act as social coordinator, but it is well known that absence of competition leads to inefficiencies and premium levels that generate monopoly rents. However, if multiple carriers compete and insure different parts of interdependent networks, they would have to engage in information sharing at a depth and speed unprecedented in conventional lines of insurance. To thwart the concerns of price-rigging in such close relationships between competitors, the whole scheme would have to be run under the watchful eyes of a trusted party.
4.4.3. Literature
Interdependent security has inspired many analytical models.[20] Most prominently, Öğüt, Raghunathan, and Menon (2011) are the first to combine the concept with market insurance and study the social coordination mechanism. Hofmann (2007) considers imperfect information and adds premium differentiation to the analysis. Bolot and Lelarge (2008) explore mean field approximation to analyze the possibility of coordinated solution with the help of insurance for selected network topologies (also Lelarge and Bolot 2009). Shetty et al. (2010) note that a coordination mechanism that maximizes welfare with the help of market insurance will not, in general, maximize the overall security investment (later extended and refined in Schwartz and Sastry 2014). Johnson, Böhme, and Grossklags (2011) study symmetric equilibria in fully connected graphs where firms can buy market insurance and invest in two types of security controls, one that generates externalities and another one that does not. Against the backdrop of this research, it is remarkable that we could not find any empirical quantification of interdependent security in a real network.
4.5. Market structure
The insurance business benefits from economies of scale and scope. The amount of safety capital needed per policyholder is smaller for large and diverse portfolios for several reasons. The central limit theorem predicts that realized losses deviate less from the distribution mean as the portfolio size increases, and fixed administrative costs can be distributed over many policyholders. Moreover, transaction costs per contract (for underwriting and monitoring) are smaller if each policyholder has multiple policies from the same insurer. Empirical evidence suggests that some conventional lines of insurance have features of a natural monopoly (Emons 2001), although the data confounds public and privately run carriers (e.g., von Ungern-Sternberg 1996). Cyber risk insurance generates additional scale effects related to the monitoring of policyholders and the topology of their connections to interdependent systems owned and operated by others. Finally, the social coordination function (see Section 4.4.2) would require tight guidance and widely accepted standards if it is to be realized by competing organizations.
Another aspect is the market structure of potential policyholders. Insurance is most efficient if insurers can pool many diversifiable risks, each big enough to be substantial for the policyholder but not catastrophic for the insurer. Concentration among policyholders renders insurance less attractive because firms may prefer to accept small risks, avoiding the transaction costs of risk transfer. Risk acceptance remains problematic for larger or internally correlated risks (Böhme and Kataria 2006), but there may remain too few policyholders to pool such risks. This is one facet of the more general “N = 1 problem” in the technology sector, where dominant suppliers are unparalleled. Tendencies of such concentration can be observed in industries such as standard software, Internet search, cloud hosting, and online social networking.
Finally, how does the existence of a market for cyber risk insurance affect competition? Arguably, if insurance can price cyber risk precisely, then premium differentiation would make more diverse risks less expensive to insure. This could partially offset the advantage of incumbent platforms and therefore stimulate technical diversity and economic competition. Both are considered desirable goals that generate positive externalities on firms that do not participate in a market for cyber risk insurance.
5. Actuarial modeling
Formal economic models often simplify loss distributions to central moments or Bernoulli trials. By contrast, premium calculation in practice requires knowledge of the full loss distribution in order to determine the right amount of safety capital (cf. equation (7)).
5.1. Data sources
The preferred data source for actuarial modeling in conventional insurance is historical claims. Due to the novelty of cyber risk, the nascent insurance market cannot look back at a long history. Deductibles and rational underreporting keep the number of data points artificially low. Moreover, historical data is of limited use, because threats, vulnerabilities, and controls evolve rapidly with the pace of the technological development.
Technical indicators are an alternative data source for monitoring the threat landscape. Typical measurement setups include
-
sensors measuring traces of known attacks (e.g., packet backscatter or passive DNS analysis, see Bilge et al. [2011]);
-
spam traps and “honeypot” computers that mimic vulnerable devices and are instrumented to sense attack behavior (Provos and Holz 2007); and
-
trackers observing command-and-control information of the botnets[21] that serve as primary infrastructure for cybercrime.
Several organizations collect this type of data and make it available to interested parties.[22] Proprietary threat intelligence may also include information collected by vendors of antivirus software on their clients’ devices. A shortcoming of these data sources is that they do not include controls and ultimately loss amounts.
The security practices of firms (and to some extent their suppliers) are primarily measured with self-assessments, typically as part of the underwriting process. Moreover, a new industry of intermediaries for cyber risk analysis is forming. These services promise security ratings based on remote technical measurements (e.g., scans of the corporate Internet address space, maturity of the corporate website technology, etc.) and aggregation of incident reports.[23] In contrast to self-assessments, rating availability does not depend on the cooperation of the rated firms. However, due to proprietary models and the novelty of these businesses, little is known about the accuracy of the ratings and their robustness to attempts of deception.
With the introduction of breach-reporting obligations for the loss of personal data, public and private registers began to collect information on incidents at the firm level.[24] Incidents at the device (or network address) level can be inferred from various blacklists compiled from end users’ abuse reports as well as from technical measurements. Law enforcement agencies maintain registers of cyber-related incidents primarily to compile official police statistics. However, these sources are known to be particularly prone to underreporting. We expect that registers will become more relevant in the future as many jurisdictions plan mandatory reporting for general security incidents and sanction noncompliance (e.g., EC (European Commission) 2013).
Victimization surveys[25] complement the list of data sources. Unlike technical indicators and incident reports, surveys draw a more representative picture of the impacts of cyberattacks on consumers and businesses. They may serve as a basis to estimate the baseline risk. Well-known limitations of consumer surveys are that questions must be notoriously superficial and the resulting data is prone to response biases (Florêncio and Herley 2011). The last data source consists of indicators inspired from finance. For example, Geer and Pareek collect and publish a monthly sentiment indicator from a panel of security experts.[26] Others suggest to monitor underground marketplaces for prices of goods and services related to cybercrime (Thomas et al. 2015; HPE 2016) or track volumes and prices on markets for vulnerabilities (Zhao, Grossklags, and Liu 2015).
5.2. Individual loss distribution
Research on loss distributions for cyber risk is scattered over multiple disciplines. The shortage of data may require Bayesian methods for extracting the maximum information from a few data points and finding appropriate ways of incorporating expert knowledge. Actuaries also need to find the right balance between parsimonious models and representative models, which convey the complexity of the networked environment. However, there is no consensus on data sources or appropriate methodology so far. Industry reports often provide estimates of central moments. For example, based on an analysis of 176 cyber insurance claims, NetDiligence (2016) reports an average cost per incident of about $0.7 million in 2016. In a study on insurability of cyber risk, Biener, Eling, and Wirfs (2015) select 994 cyber events from a commercial database of publicly reported general operational losses between 1971 and 2009. They report a mean loss per cyber incident of $40.5 million. Several authors (Gordon, Loeb, and Zhou 2011; Gatzlaff and McCullough 2010) consistently report a negative stock market reaction following the announcement of breaches at publicly traded companies. The effect is on the order of 1% in terms of short-term cumulative abnormal return, a common metric of the event study method (MacKinlay 1997). This translates to losses per incident on the order of $300 million under the assumption of an average market capitalization of NASDAQ-100 companies between 2000 and 2010.[27]
All these figures are not directly comparable because contexts, conditions, and methods vary between studies. Should average losses be reported per record, per incident, per firm, or for entire sectors or economies? Shall losses include indirect costs? Shall they include or exclude recovered values? Unfortunately, some of the frequently cited studies are not even transparent about their methodology. Academics have flagged these issues (e.g., Anderson et al. 2013; Riek et al. 2016), but a commonly agreed knowledge base is still not within reach. One may hope that the experience of the insurance industry will facilitate the development of comparable standards for this risk class.
Even if estimates of central moments were accurate and comparable, they reveal very little about the shape of a loss distribution. Most loss distributions are skewed to the right. For example, the mean estimate of $40.5 million in Biener, Eling, and Wirfs (2015) originates from a distribution with a median of only $1.9 million. Its mean is inflated by a few outliers of up to $13.3 billion. This calls for a closer look at the tails of the individual loss distributions. In comparison to operational losses not classified as cyber, Biener, Eling, and Wirfs (2015) observe that cyber losses exhibit shorter (right) tails than conventional risks. This somewhat qualifies concerns raised by earlier studies reporting distinctive features of heavy tails in cyber loss data (Maillart and Sornette 2010; Edwards, Hofmeyr, and Forrest 2016; Wheatley, Maillart, and Sornette 2016).[28]
The left tail deserves attention as well. Data from a consumer victimization survey indicates that loss distributions are zero-inflated even after controlling for the (rather unlikely) event of becoming a victim of cybercrime. According to Riek et al. (2016), only 33% of identity theft[29] victims in online banking suffer monetary losses. This subset of victims experiences direct financial losses of on average €2,150 per incident; the median is €630. This highlights the errors caused by replacing these kind of loss distributions with a simple Bernoulli loss model (see Section 4.2), where the probability of a fixed loss of €2,150 would be p = 0.007 in five years, suggesting an actuarially fair (i.e., lower bound) premium of about €3 per year if the entire population was insured.[30] Recall that knowledge of the shape of the individual loss distribution is necessary (but not sufficient) for determining the compound loss distribution.
5.3. Compound loss distribution
The compound loss distribution determines the realization of aggregate claims against an insurer who covers a pool of many risks. It is given by the convolution of all individual loss distributions if the risks are statistically independent. However, this important condition does not apply to large parts of cyber risk. The very success factors of information technology, economies of scale, standardization of programmable devices, and global networks create complicated dependence structures between loss distributions of networked components. This is because standard software has common vulnerabilities that can, in the worst case, be exploited remotely at global scale.
The risk of correlated failure has been prominently mentioned by Geer et al. (2003), at the time attributed to the near-monopoly of Microsoft on the desktop software market. With Unix-based alternatives regaining strength as well as competing and fragmented platforms in the mobile market, the situation has somewhat changed. However, vulnerabilities in popular libraries such as zlib or OpenSSL, which are open source and widely used on all platforms, remain a source of concern. Similarly, concentration on the market for basic cloud services (infrastructure and platforms) may lead to correlated failures of downstream cloud services. Consequently, an insurer’s profitability in cloud services policies (or business interruption if the business depends on such services) rests on the second- or third-tier cloud operators’ ability to avoid single points of failure.[31]
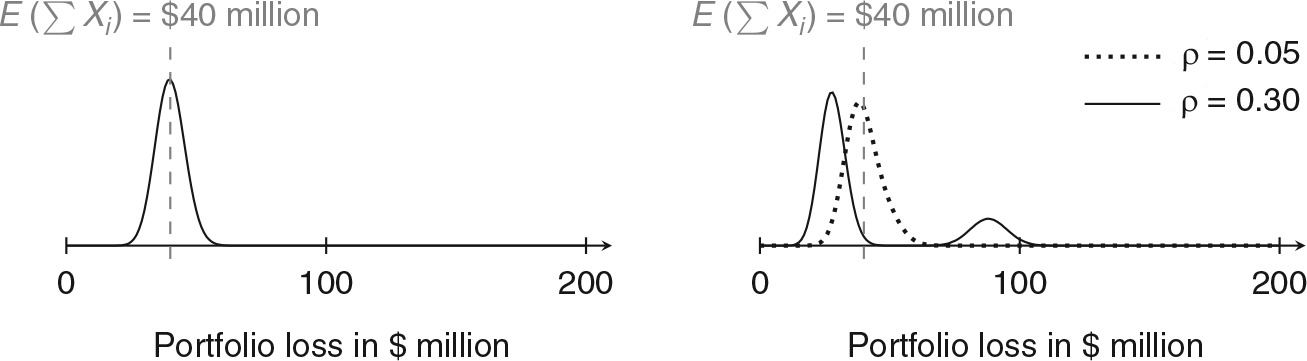
Positively correlated risks generally shift the probability mass of the compound distribution to the extremes, thereby thwarting the balancing property of pooled risk, the very principle that makes insurance economically viable. Figure 5 illustrates this for n = 200 homogeneous Bernoulli risks, each causing a fixed loss of l = $1 million with probability p = 0.2. We use a single-factor model of correlation, where a fraction ρ of the loss probability is determined by a common Bernoulli trial—for instance, a newly discovered vulnerability in standard software. The model is set up to keep the expected portfolio loss independent of the strengths of correlation ρ (see Böhme [2005] for the specification). It demonstrates that correlation affects the shape of the compound loss distribution. With increasing ρ, more and more probability mass is shifted to the sensitive right tail. In the extreme case of ρ = 0.3, the insurer faces a non-negligible risk of losing $100 million in a period, more than twice as much as it can expect in premiums if the actuarially fair premium is taken as a baseline. To some extent, this can be compensated for by increasing the loading λ (cf. equation (7)), but the market disappears if higher premiums π render risk transfer uneconomical for firms’ levels of risk aversion.
_and_correlated_(.png)
Estimating the compound loss distribution for a portfolio of real cyber risks is a major challenge. Cyber risk insurance suffers from a lack of reliable data in general, and estimating multivariate properties, such as correlation coefficients between distributions, demands even more data points than estimates of univariate (central) moments. Moreover, the dependence structure between many risks is most likely not homogenous, and may be more complex than linear correlation between central moments. Extreme value theory has been applied in finance and insurance (Embrechts, Klppelberg, and Mikosch 1999) in order to characterize and estimate tail risk in compound loss distributions. If individual risks are dependent, copulas offer very general models of dependence between variables that can be parametrized to account for co-occurrence of extreme events (Nelsen 1999). These ideas have been brought to cyber risk analysis. Using a t-copula, which captures tail dependence, Böhme and Kataria (2006) report evidence for positive dependence between the attack activity observed at 35 globally distributed sensors (honeypots—cf. Section 5.1). This data source tracks threat information, not losses or claims. The result can nevertheless be interpreted as an indication of structural dependence, which will also drive the relevant loss distributions for insurers.[32]
In the absence of empirical data, analysts must resort to simulations. They can leverage the network environment component of the cyber risk insurance framework (Figure 3) to study propagation of risk along the edges of the graph structure. Lorenz, Battiston, and Schweitzer (2009) propose a methodology based on the popular (but often misleading) mean field approximation.[33] Johnson, Laszka, and Grossklags (2014) study the computational complexity of the exact solution for different classes of topologies. While homogeneous networks and star-shaped topologies (see the second and third examples in Figure 4) permit efficient solutions, the problem is NP-hard in general. For the special case of scale-free networks, the authors show that the compound loss distribution cannot be computed from a random sample of nodes, a plausible situation for an insurer who shares the market with competitors or firms that mitigate, accept, or avoid their risks. Many natural networks, foremost the routing topology of the Internet, exhibit scale-free characteristics.
Note that this topology may be, but is not necessarily, aligned with the topology governing interdependent security (see Section 4.4). Both concepts are related, but distinct. Interdependent security connects defense functions and thus parameters of individual loss distributions. By contrast, risk propagation leads to cumulated risk, that is, dependence between realizations of losses. Correlation is a special form of the latter. In other words, firms anticipate interdependent security in their cyber risk management, whereas insurers (and their regulators) must primarily be concerned about cumulated risk.
The fear of cumulated cyber risk led reinsurers to explicitly exclude cyber risk in the early 2000s, a fact still named as a barrier to the development of cyber risk insurance a decade later (ENISA, Robinson, and RAND Europe 2012). Alternative forms of bulk cyber risk transfer, such as securitization or catastrophe bonds, have been discussed but cause concerns about moral hazard by investors who may find themselves in a position where they benefit from cyber incidents (Anderson et al. 2008).
6. Conclusion
Cyber risk insurance as a risk management tool has not kept pace with the adoption of information technology. At the time of writing, the market is about to develop, primarily in comfortable niches, but increasingly taking on more substantial exposure. If there is anything to be learned from the last financial meltdown, adding layers of indirection is a good idea only if the party that takes the risk is in a better position to understand, mitigate, and eventually bear it. Cyber risk quantification faces many challenges in the first place. It differs, as laid out in this paper, in many important respects from the conventional risks for which the insurance industry has built an expertise to model and price.
This paper could close with the known mantra and call for more actuarial data, or it could complain about the chicken-and-egg problem that actuarial data will not become available unless policies are written and claims filed. However, even decades of claims about “yesterday’s attacks” will not inform about “tomorrow’s risk” in a domain where “moving-target defense” has become a dictum. Models of cyber risk arrival need to be more predictive. They must draw on the available data at earlier stages of our cascade model of cyber risk arrival (cf. Figure 2). This includes information about the dependence topology. This calls for data-sharing frameworks between competitors or with intermediaries in order to be able to calculate compound loss distributions for the parts of a larger network in an insurer’s portfolio.[34] Some authors see a role for the government as a standard-setter to facilitate this exchange (e.g., Biener, Eling, and Wirfs 2015).
More systematic collection and evaluation of data at early stages is also essential for identifying risk factors and quantifying their effects. The checklists used for underwriting cyber risk today may help lawyers identifying conditions precedent to liability, but they seem too superficial for meaningful premium differentiation. Premium differentiation, however, is a crucial instrument to stimulate better security practices at deployment and operations and, in the long run, pass the signal up the supply chain, where it could stimulate more risk-conscious software development and systems engineering (Heitzenrater, Böhme, and Simpson 2016). If this channel is too indirect and slow, insurers could take a more active role and liaise with software vendors. Laszka and Grossklags (2015) outline how insurers can proactively try to remove software vulnerabilities in order to reduce correlated risk and tighten the critical right tail of the compound loss distribution. While the idea is appealing, and has been mentioned by Anderson (2008) and Böhme (2005), it implies that insurers enter an unfamiliar partnership with the software industry. Moreover, it requires collective action because no insurer has incentives to be the first mover if all competitors benefit equally from the fruits of the efforts.[35] These and other lessons learned from the analysis in this article are summarized in Box 3.
Foreseeable future developments include that more industries will follow the model and the economic logic of the software industry. Consequently, more risk is taking the characteristics of cyber risk. Current technology trends, such as the Internet of things, the wake of a fourth industrial revolution, autonomous vehicles, and mass-customized medication based on computer-assisted diagnosis, just to name a few, support this point. In this context, the need for cyber risk analysis is paramount on the individual and compound level. It is hardly responsible to embrace further increases in society’s dependence on information technology without being able to monitor the resulting cyber risk with principled and scientific methods.
Another stream of current technology development explores massively distributed systems formed by pseudonymous actors that execute long-running protocols on top of the Internet infrastructure. These protocols update a cryptographically secured global data structure and resolve inconsistencies and conflicts without a central party. The success of Bitcoin, a virtual currency scheme and the most prominent example today, has drawn attention to this technological paradigm (Böhme et al. 2015). Although its future is subject to high uncertainty, a possible wider adoption has two important implications for cyber risk analysis. First, distributed ledgers (an umbrella term for said systems) produce a very different sort of cyber risk than described in this article. Besides technological factors, this novel cyber risk is determined by new “laws of nature” enforced by cryptography as well as the aggregate behavior of many autonomous algorithms reacting to these laws. Ground-breaking research and modeling effort is needed before these risks can be priced and transferred. Second, this technology has become a platform for disruptive innovation of financial intermediation, with Bitcoin taking the lead on payments systems. Speculatively, this may not only change the type of risk insured but revolutionize the way we think about and organize insurance.
Acknowledgments
The authors gratefully acknowledge funding from the CAS Task Force on Cyber Risk. We also thank Avraham Adler and Karen Sonnet for the comments and suggestions provided on earlier versions of this report and the anonymous reviewers for their constructive feedback, which significantly improved the final version.
It is possible to design circuits and software with automated verification in mind. This technology is orders of magnitude more expensive than common personal computer or smartphone technology and thus exclusively used for critical applications, such as passenger aircraft or nuclear power plants.
The canonical risk management instruments further include risk avoidance and risk acceptance.
For further details on the hack at Sony Pictures, see [www.washington post.com/news/the-switch/wp/2014/12/18/the-sony-pictures-hack-explained/](www.washington post.com/news/the-switch/wp/2014/12/18/the-sony-pictures-hack-explained/).
The principle of indemnity for non–life insurance states that insureds must not profit from the occurrence of a loss event (cf. Mehr and Cammack 1972). Hence, an upper bound for the compensation is the actual loss incurred.
On terminology: we use firms as shorthand for professionally managed organizations in the private or public sector exposed to cyber risk. Firms appear on the demand side of insurance markets. Policyholders are firms who have acquired coverage from insurers. Vendors supply information technology and software to firms.
In most cases, other parts of the data packet contain instructions that reprogram the software.
One may still hope that the bank has better processes and hires more qualified staff to look after its security.
There is no benefit in storing passwords in plaintext. Best practice is to transform them with specialized cryptographic one-way functions including a different constant (“salt”) for each user account.
For further information, see www.darkreading.com/risk/compliance/target-pci-auditor-trustwave-sued-by-banks/d/d-id/1127936.
Some authors normalize all monetary values to the unit of the loss, allowing them to define l = 1.
Security investment corresponds to the concept of self-protection in the sense of Ehrlich and Becker (1972).
Classes of utility functions vary in whether and how the preference for certainty depends on initial wealth. Utility functions with the constant relative risk aversion property are independent of a firm’s initial wealth.
Even simpler models producing the same qualitative results restrict one or both choice variables to two options: s {0*,* s}, x {0*, l*}. This simplifies the optimization problem to a comparison of cases.
Because firms can eliminate all variance without sacrificing expected wealth. Marginally risk-averse decision makers prefer this situation. Security investment must be zero because otherwise firms could improve their wealth by reducing s; a move that must be anticipated by the insurer’s choice of p, triggering a race to the bottom.
Ruin theory predicts that if insurers collect only actuarially fair premiums, they will eventually go bankrupt with certainty. Hence, a strictly positive loading l is necessary to help ensure that the insurer exists at the time policyholders need it. Moreover, the qualifier “fair” is a technical convention established in the economics literature. It does not imply a value statement. Other definitions coexist. For example, principle 4 of the Casualty Actuarial Society’s Statement of Principles Regarding Property and Casualty Insurance Ratemaking specifies, “A rate is reasonable and not excessive, inadequate, or unfairly discriminatory if it is an actuarially sound estimate of the expected value of all future costs associated with an individual risk transfer” (emphasis added).
In principle, also the loss size l may differ between firms. We stick with our approach to modify the loss distribution on the risk arrival side only in order to keep the equations simple. A practical model for numerical analysis should allow for more realistic loss distributions than Bernoulli trials.
Risk aversion and imperfect information on the demand side may counterbalance part of this problem in practice. Firms that do not know their risk exposure or security level or that are highly risk averse may stay in the pool despite being good risks in objective terms.
The term has been coined by Kunreuther and Heal (2003), while Varian (2002) has modeled the same phenomenon for cyber security slightly earlier.
The example assumes risk-neutral firms because we do not consider market insurance. Qualitatively similar results can be found for models with risk aversion (e.g., Johnson, Böhme, and Grossklags 2011).
Many economic analyses of cyber risk insurance have appeared in technical venues. This has led to some abuse of terminology, which may cause confusion to people entering the area. For example, a conference paper with “market analysis” in its title does not model a market (Pal et al. 2014); a workshop paper with “insurance” in its title does not consider risk aversion (a necessary condition for insurance) but models a social redistribution scheme (Naghizadeh and Liu 2014); t, Raghunathan, and Menon (2011) use “correlation” in the title but model interdependent risk; and Shetty et al. (2010) model an unconventional type of risk aversion by leaving the security investment outside the utility function (unlike equation (27) of Ehrlich and Becker [1972]).
A botnet (robot network) is a network of compromised computers, reprogrammed to be controlled remotely by criminals.
For example, https://zeustracker.abuse.ch by the feed provider ZeuS Tracker, www.confickerworkinggroup.org by the Conficker Working Group, www.shadowserver.org by the Shadowserver Foundation, https://honeynet.org by the Honeynet Project, and www.zone-h.org created by Roberto Preatoni.
For example, the enterprises SecurityScorecard, Bitsight, and QuadMetrics.
For example, https://datalossdb.org operated by the Open Security Foundation, www.privacyrights.org/data-breach by the Privacy Rights Clearinghouse (see Edwards et al. [2016] for a statistical model of breach sizes in this dataset), and the VERIS Community Database http://vcdb.org, one of the data sources of the annual data breach investigation report published by Verizon.
Prominent examples are the annual reports of the Computer Security Institute (CSI) published between 1996 and 2011 (e.g., CSI 2011), periodical Eurobarometer studies (e.g., EC 2015), and global studies carried out by private firms (e.g., PricewaterhouseCoopers 2016).
The number is considerably smaller at $80 million for the average company in the NYSE Composite, which includes smaller and less-technology-focused companies.
Note that heavy tails are observed primarily for the count data of breached records whereas moderate tails are observed in monetary losses (of otherwise incomparable data sources). Besides many other factors, this may hint at a concave relationship between the number of breached records and the total cost of a breach.
Attackers impersonate their victims using stolen access credentials or identifying information.
The survey asked for incidents in the past five years. About 2% of the sample reported victimization experience for the specific case of identity theft in online banking. The data is representative for the adult population of Internet users in six European countries: Germany, Estonia, Italy, The Netherlands, Poland, and the United Kingdom.
Insurers may exclude this type of risk, but the resulting policies will be considerably less attractive to businesses using cloud services. They might also try to hold suppliers liable after incidents, but large events will soon exhaust the suppliers’ capital stock.
Copulas have also been proposed to obtain more precise individual loss distributions of large enterprises where a single threat can affect many devices at the same time (see Herath and Herath 2007).
The drastic simplification of this approach drops all local information about interactions between nodes and replaces it with a global average.
Compliance with privacy and data protection laws is an important requirement for such information-sharing arrangements. The legal and technical aspects thereof require further scrutiny.
A conceivable, but morally and economically questionable, alternative would be to allow for hardened versions of software or services for policyholders of “activist insurers.” The increasing system diversity would nonetheless generate positive externalities for competitors and uninsured firms.