


1. Introduction
Experience rating for individual workers compensation risks dates back to the beginning of the Casualty Actuarial Society (CAS) and workers compensation insurance in the United States. Early volumes of the Proceedings of the Casualty Actuarial Society (PCAS) contain numerous papers on experience rating individual workers compensation risks and the credibility of individual risk experience (Dorweiler 1934; Edwards and Woodward 1915; Fisher 1916; Greene 1915; Johnson 1941; Kormes 1934, 1935; Michelbacher 1918; Perryman 1937; Senior 1925; Smick 1939; Whitney 1918). This area of ratemaking is also somewhat unique in CAS history in that from the beginning, fitting credibility values and performance testing of consequent modification factors has involved a “predictive” framework, simultaneously comparing data on previous loss experience and subsequent loss experience (particularly see Dorweiler 1934).
This paper describes a recent multi-year review of the NCCI’s Experience Rating Plan. NCCI Staff performed many different analyses. These analyses were presented for review and discussion at periodic meetings of NCCI’s Individual Risk Rating Working Group. The IRRWG consists of actuaries representing workers compensation insurers that are affiliates of NCCI.
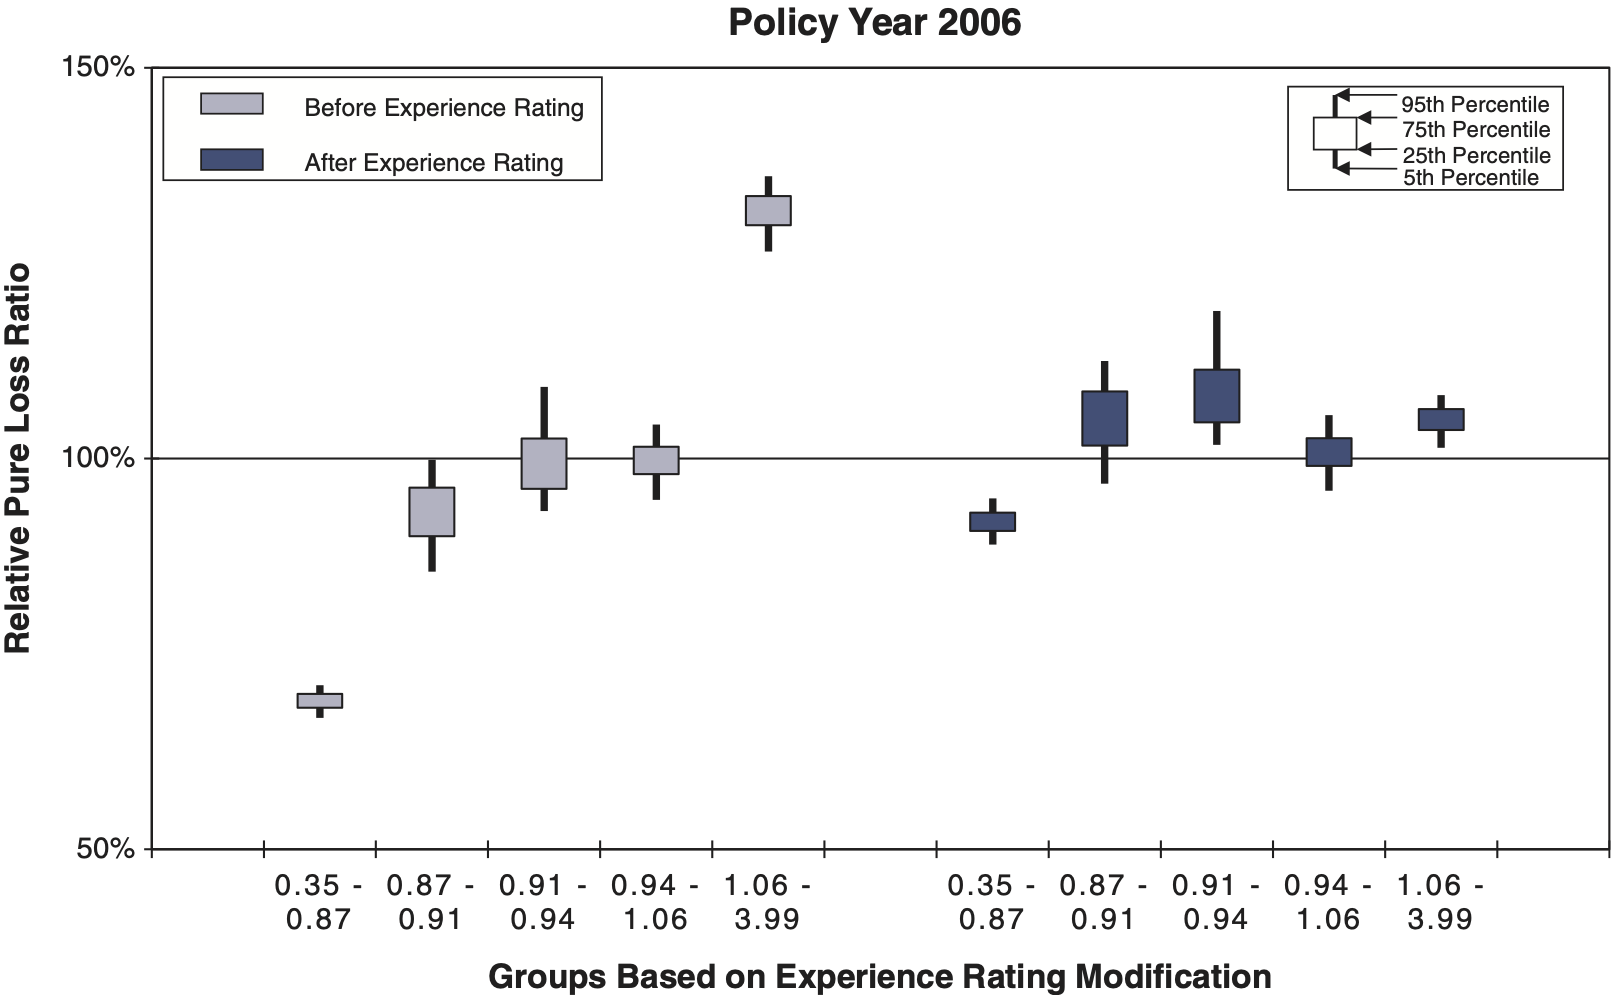
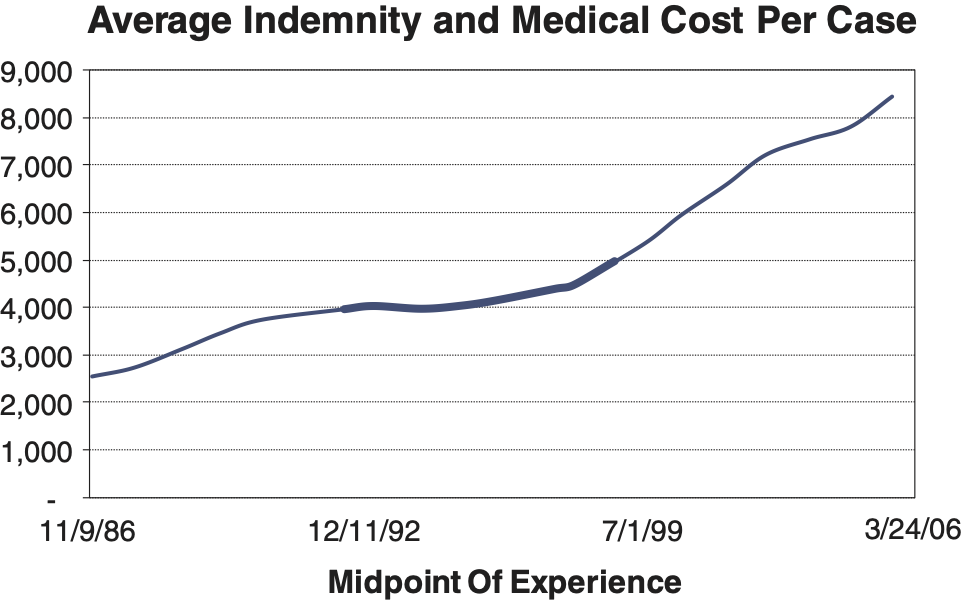
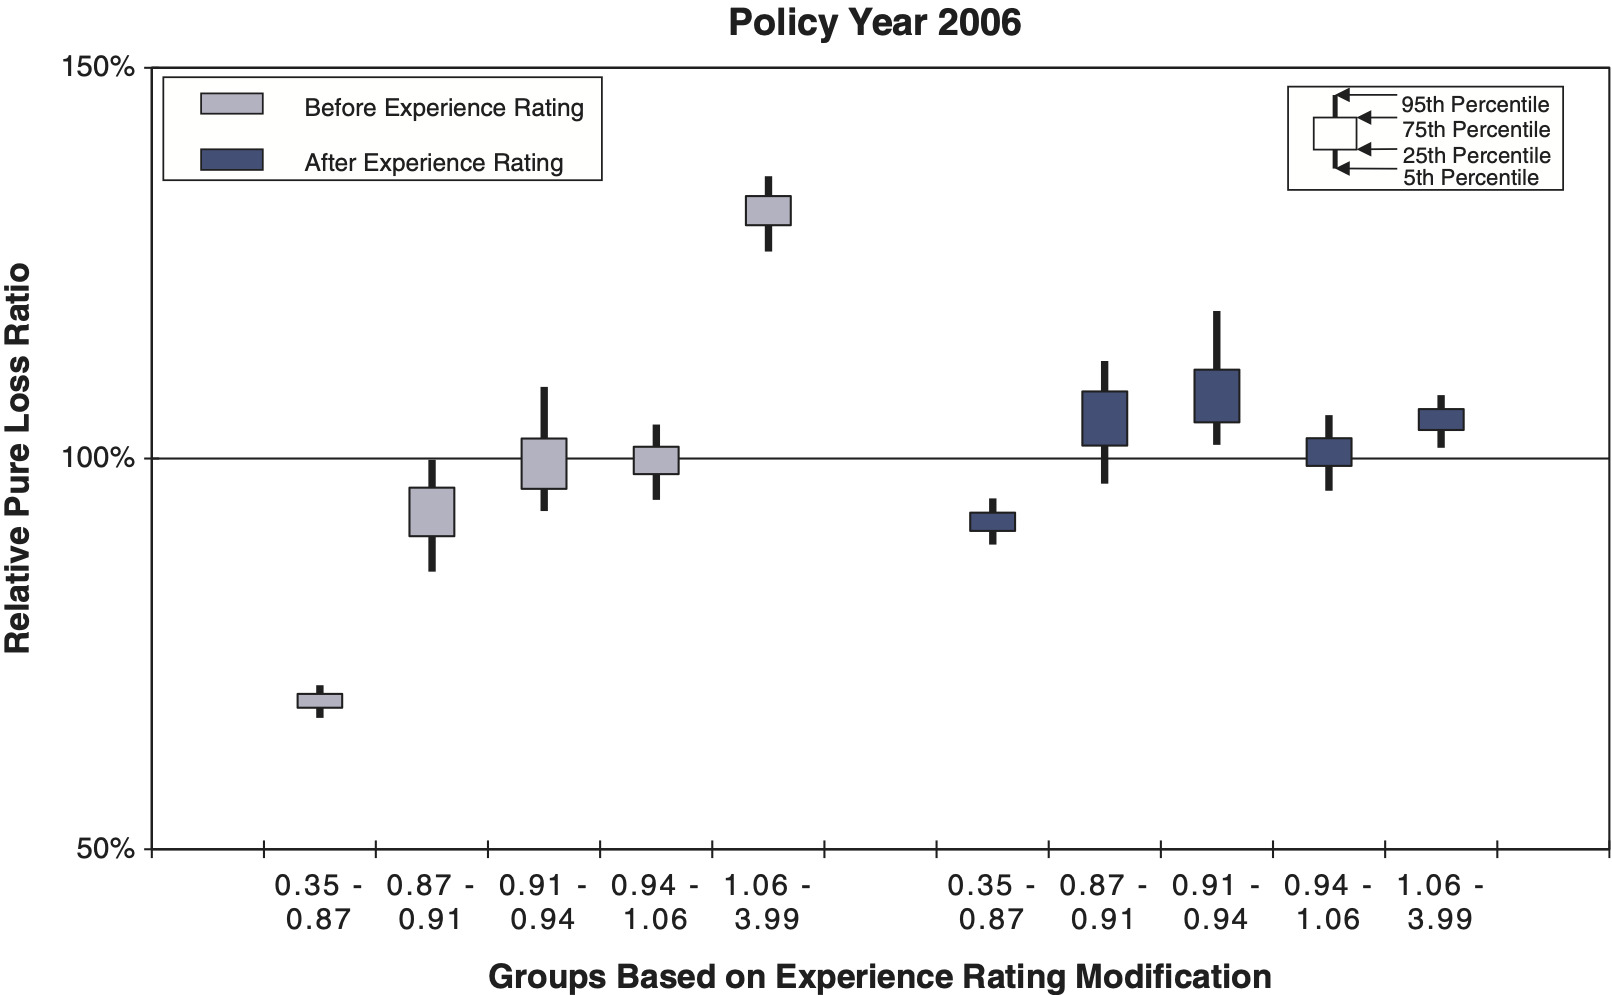
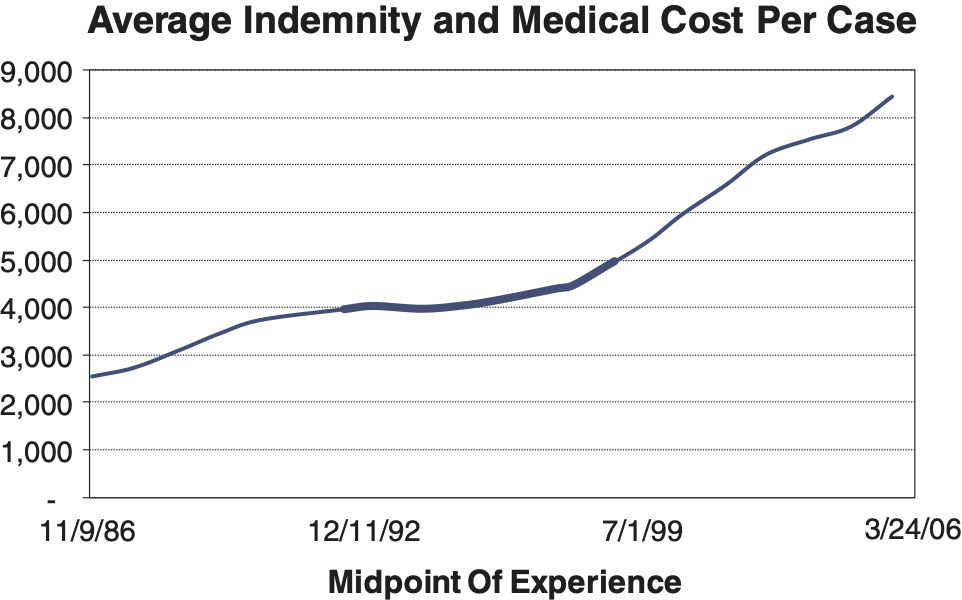
The review process confirmed that the ER Plan was performing well into the first years of the 21st century. In more recent years, quintile testing (Figure 1) began to show slight upward slope in modified relative pure loss ratios. (See the first part of Section 2 and Section 2.1.4 for a detailed description of quintile testing.) This was ultimately diagnosed to be a consequence of the split point between primary losses and excess losses remaining fixed while severity had increased significantly. The severity index associated with the split point had remained relatively flat for some years after NCCI’s 1998 adjustments to the ER Plan. However, by Policy Year 2006 the severity index had more than doubled (Figure 2) and anticipated trends placed it on course to triple by around 2011–2013.
In response, NCCI has implemented a major increase in the split point from $5,000 to $15,000+ inflation (to be phased in over three years), and subsequent procedures to periodically increase the split point in the future corresponding to an index of claim severity. Along with the split point increase, the maximum cap on modification factors was changed.
While the ER review was being conducted, NCCI also implemented several changes to its class ratemaking methodology (Daley 2009). To accommodate class ratemaking changes in the ER Plan, changes were made to the calculation of D-ratios, which determine the fraction of expected experience period loss which is primary, and Expected Loss Rates (ELRs), which are rates of experience period expected ratable losses.
1.1. Research context
The content of this paper is primarily related to individual risk rating and credibility. Although the application is to workers compensation specifically, the methods shown are generally applicable to other casualty insurance. Background and specific details on the NCCI Experience Rating Plan will not be repeated here. Before reading this paper all readers, particularly those who do not routinely deal with the details of the plan, would be well advised to review one or more of several readily available references (Evans 2014; Gillam 1992a; Gillam and Snader 1992; Gillam 1992b; Mahler 1998; Meyers 1985; NCCI 1998; Venter 1987). The most complete documentation of the specifics of the plan can be found in [NCCI, updated annually]. A number of papers from the early decades of the Proceedings of the CAS deal with individual risk rating in workers compensation (Dorweiler 1934; Edwards and Woodward 1915; Fisher 1916; Greene 1915; Johnson 1941; Kormes 1934, 1935; Michelbacher 1918; Perryman 1937; Senior 1925; Smick 1939; Whitney 1918). There are also a few other directly relevant PCAS papers from the middle of the 20th century (Bailey 1961; Stevens 1959; Uhthoff 1959).
1.2. Outline
Section 2 will describe some highlights of the review. The major changes to the ER Plan resulting from the review will be discussed in Section 3.
2. Review of the experience rating plan
The purpose of experience rating is to improve the estimate of future expected losses for an individual risk using previous actual loss experience for that risk. The basic formula for the experience rating modification factor, or mod, is (2.1).
Ap+WAe+(1−W)Ee+BE+B
Ap = actual primary ratable loss from the experience period
Ae = actual excess ratable loss from experience period
Ep = expected primary ratable loss from the experience period
Ee = expected excess ratable loss from experience period
E = Ep + Ee = expected ratable loss from experience period
B = ballast value
W = weight value
An alternative form that more directly illustrates the credibility values used in the mod formula is (2.2).
1+ZpAp−EpE+ZeAe−EeE
Zp = primary credibility
Ze = excess credibility
Ratable loss in the experience period includes a subset of total loss, determined through various exclusions such as individual loss limit, 70% exclusion of medical only losses, etc. Various specifics of the basic formula components and other aspects of the mod calculation have been changed in recent decades through special NCCI item filings. These filings include the revised Experience Rating Plan (RERP) in 1991, the Graduated Experience Rating Tables (GERT) in 1995, the Experience Rating Adjustment (ERA) in 1998, and the recent split point and maximum mod changes in 2012 based on the review described in this paper (and contained in Item Filing E-1402). As of this writing (2013), among states where NCCI files loss costs or rates, almost all have adopted ERA and Item E-1402. See Appendix A in Evans (2014) for more details on the history, such as the changing definition of primary and excess losses.
Experience Rating Plan performance is measured by the extent to which manual basis pure loss ratios vary by mod, increasing as mod values increase, and the uniformity of modified basis loss ratios across different mod values. It can be shown empirically through a quintile test of effective period relative pure loss ratios that the mod performs fairly well according to these two criteria (Figure 1). For the quintile test, risks are sorted by mod value and then grouped into five quintiles, each having an equal number of risks. Relative pure loss ratios on a manual and modified basis, respectively, for each quintile are shown in a chart. The review focused on how various aspects of the calculation affected performance of the plan, extensively using quintile testing to measure performance.
2.1. Stages of the review
The review was intended to be fairly comprehensive, and aspects of the plan to be reviewed were organized into four categories to be reviewed in roughly sequential stages, or tiers:
-
Severity Index
-
Data and Caps
-
Expected Losses
-
Credibility
2.1.1. Severity index
Severity indexation is used to update the maximum mod cap, the state accident limit, and the weight and ballast credibility values as part of NCCI class rate filings, which generally occur at the state level on an annual basis. The NCCI Experience Rating Plan Adjustment (ERA) of 1998 (NCCI 1998) also provided for indexation changes of the split point separating primary and excess losses on a national basis, but with no regular schedule or connection to periodic rate filings specified. Severity indexation is used to ensure that future performance will not be eroded by inflation in average claim amounts.
NCCI produces several different indices for experience rating that are substantially the same, but in practice are specified differently (Table 1):
-
State Average Cost Per Case (SACC), for all claims including medical only
-
State Reference Point (SRP) 250 × SACC
-
State Accident Limit (SAL) 25 × SACC
-
“G value” SACC / 1000
The ERA filing referenced a countrywide Average Cost Per Case (ACC), very similar to the State Average Cost Per Case, in connection with the split point (Figure 2).
An alternative index merits consideration if it varies between states and/or over time distinctly from the current index. Note, as will be described later, the severity index used for split point adjustments is on a countrywide basis and does not vary by state, unlike other severity indices used in the ER Plan. Alternative indexes that are very highly correlated to each other can be pared down to a single representative alternative. Secondly, the percentage claims and fraction of losses exceeding the state accident limit implied by an index should be relatively constant between states and over time. Several alternatives were investigated:
-
State Average Claim Cost with 70% Exclusion of Med Only Losses
-
State Average Cost Per Lost Time Claim
-
State Average Cost Per Serious Claim
-
State Average Weekly Wage (SAWW) capped at 150k on an annual basis
-
Medical CPI
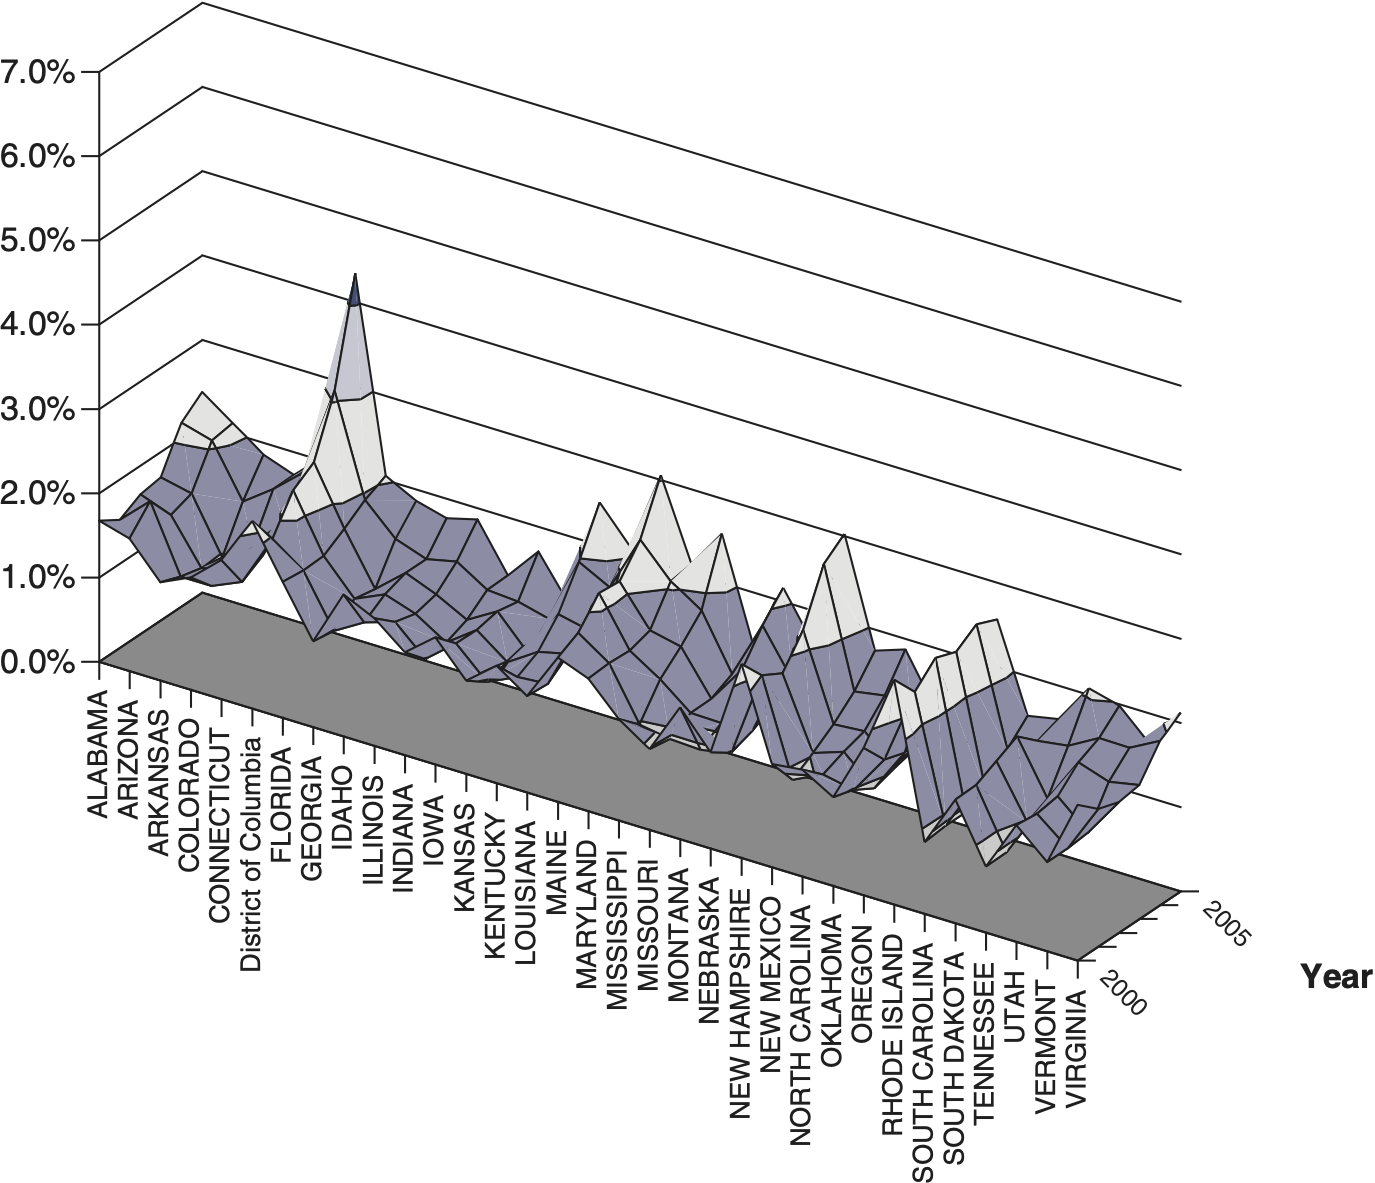
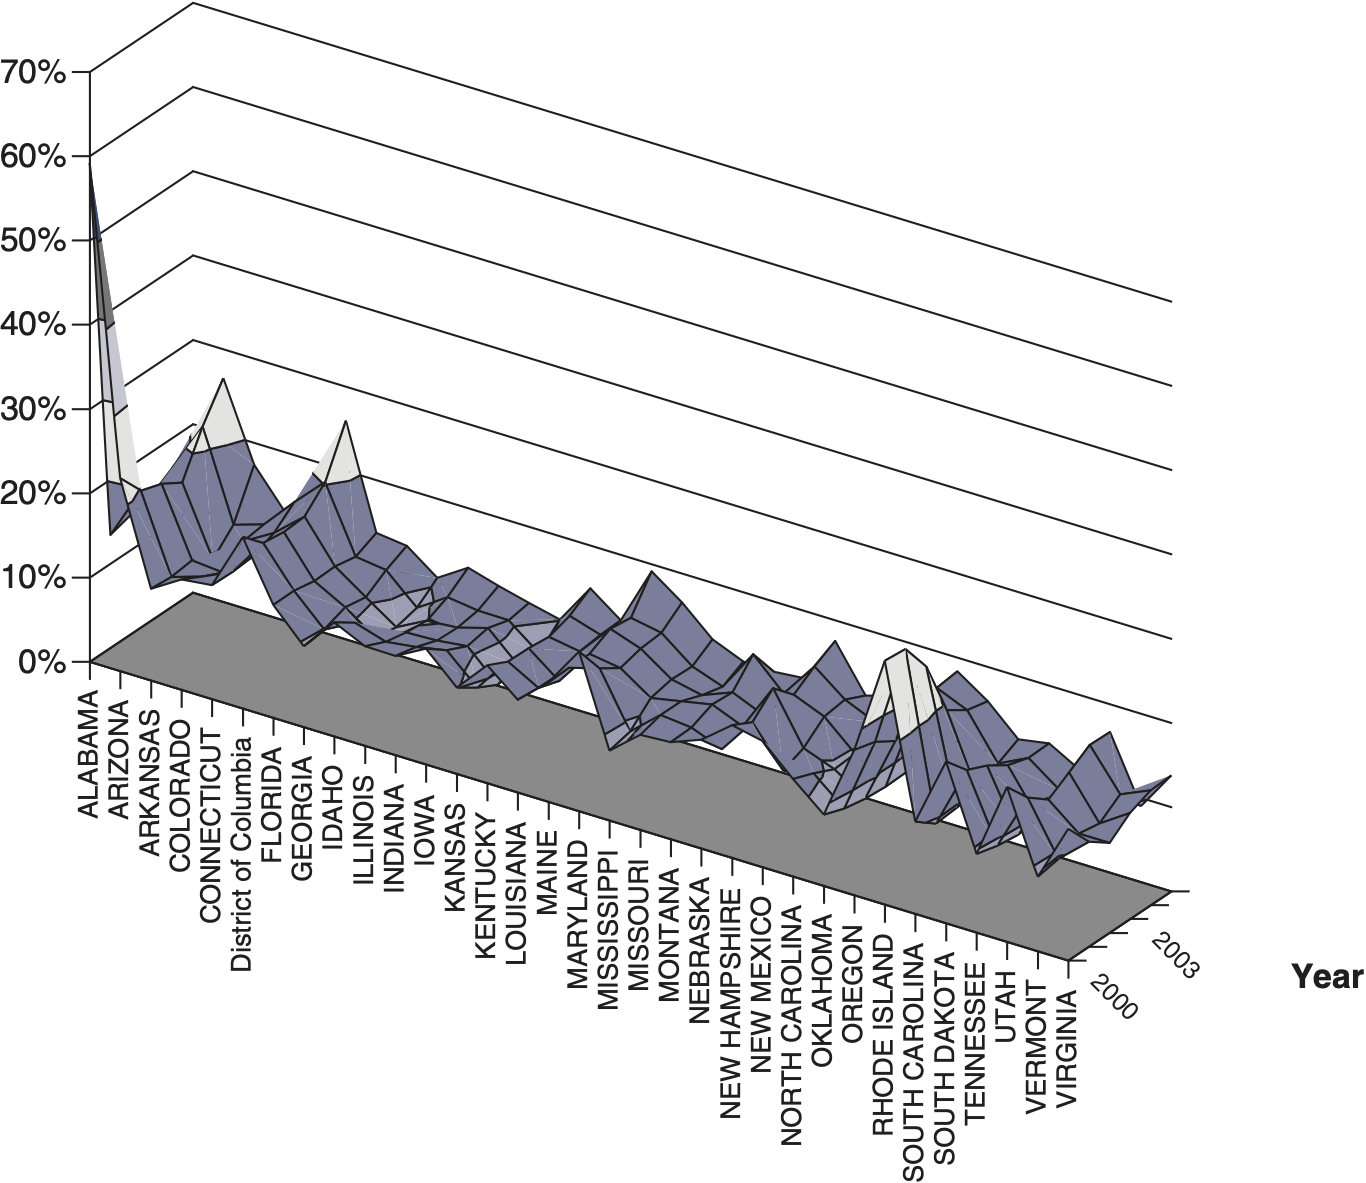
Only the State Average Cost per Lost Time Claim showed any promise of being both distinct from the current State Average Claim Cost basis and potentially more constant in terms of the excess percentage criteria (Figures 3, 4, and 5). However, ultimately this potential advantage was judged not great enough to warrant further investigation or the potential expense of such a fundamental change to the indexation bases.


2.1.2. Data and caps

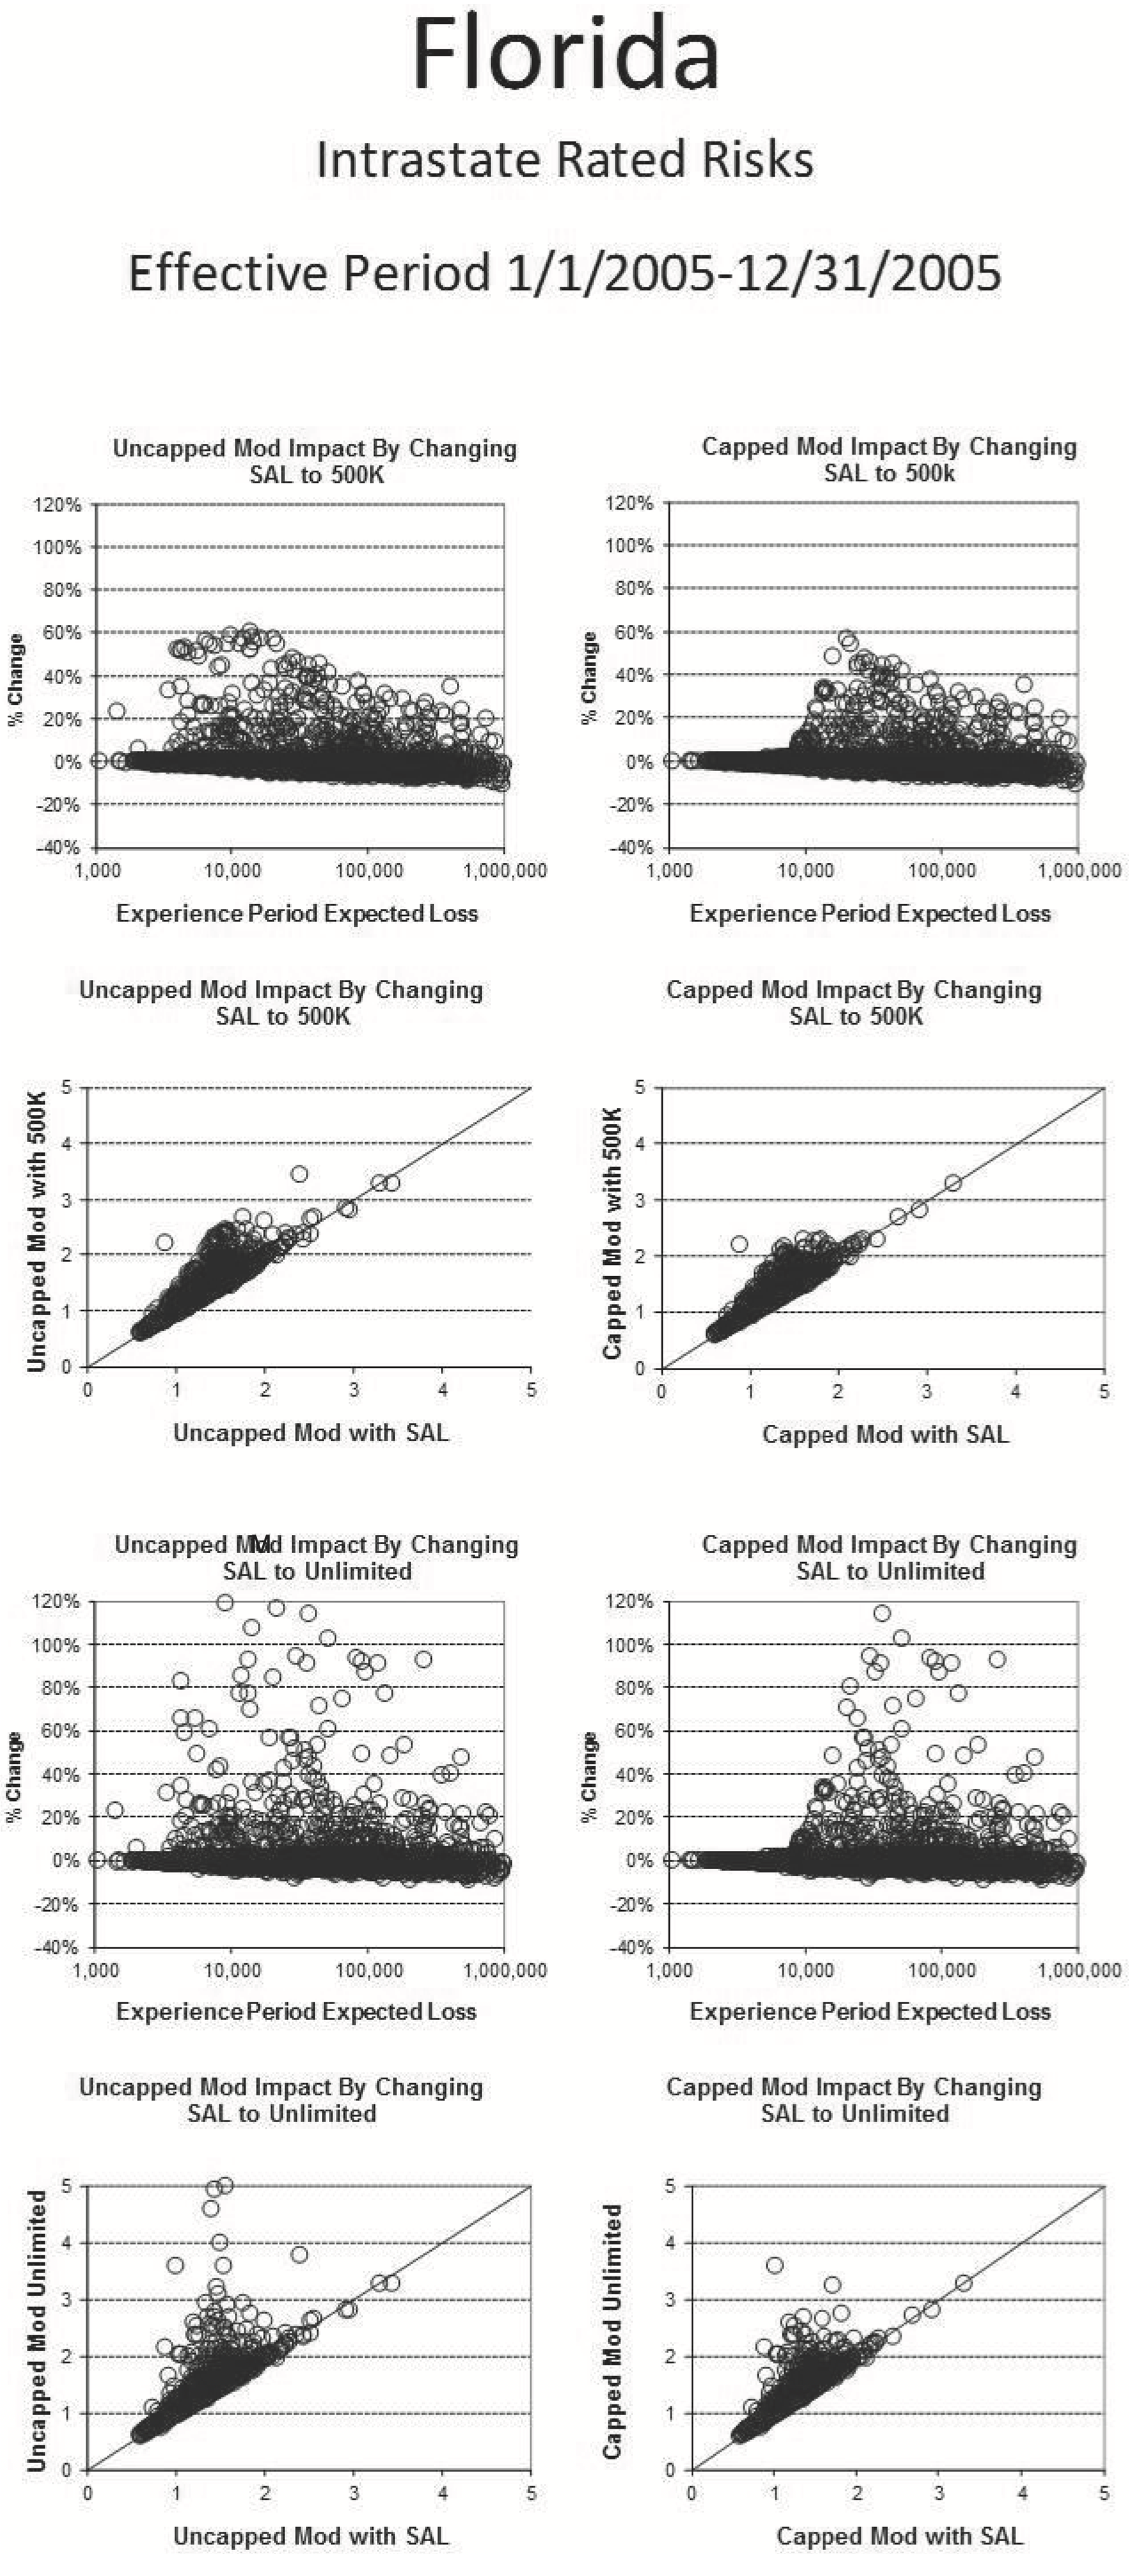
This tier included topics such as the per claim limit (State Accident Limit), multiple claim limit, exclusions of catastrophic losses, maximum mod cap, 70% medical only exclusion, experience period, and special state and class exceptions to standard calculations. These features of the plan are less geared toward statistical or performance optimization but are selected with regard to practical considerations and buffering the impact of the mod in special cases for individual risks (as shown in Figure 6). For example, 70% of medical only losses are excluded from the mod calculation to remove the potential incentive for employers to not report small medical only claims. Figure 6 shows some examples of the impact of the maximum mod cap and the State Accident Limit on the mod at the individual risk level.
Analysis and discussion with members of the IRRWG uncovered no areas of great concern, aside from a longstanding issue with the practice of net reporting, which occurs in a small number of states where losses net of deductibles are used in experience rating. In most states requiring net reporting, actual experience period losses utilized in the mod calculation are net of policy deductibles, but experience period expected losses must be calculated gross of deductibles. This introduces a subsidy between policyholders without deductibles and those that choose deductibles. Previous NCCI attempts to adjust expected loss calculations (another tier of the review) for deductibles had been rejected by regulators in some net reporting states. In those jurisdictions, the subsidy is acknowledged by regulators and considered appropriate public policy as a means to encourage use of deductibles (the assumption being deductibles are a safety incentive). The 70% med only deduction overlaps some of the loss that would be under deductibles and partially mitigates the actuarial problem caused by the mismatch between actual and expected experience period losses in net reporting states.
2.1.3. Expected losses
Expected Loss Rates (ELRs) are multiplied by payroll in the experience period to produce total expected ratable losses for calculating the mod. The D-ratio, an estimate of the fraction of ratable losses which are primary, is used to separate this total into primary and excess components. Several statistical measurements of actual to expected losses for the experience period were explored, but none were found particularly insightful or resulted in any recommendations for changes to ELR or D-ratio calculations.
The calculation methodology and details underlying the ELRs and D-ratios were reviewed and found to be basically sound.
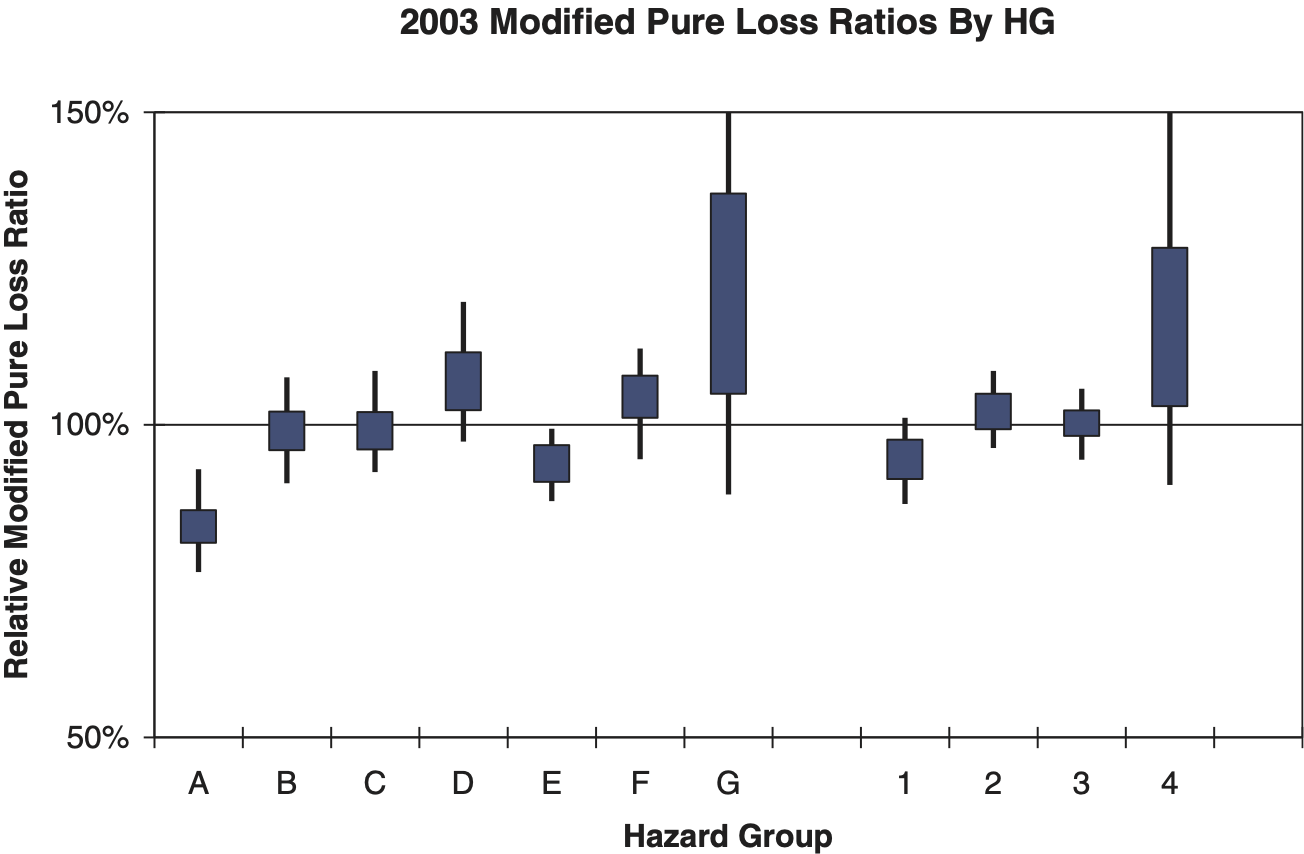
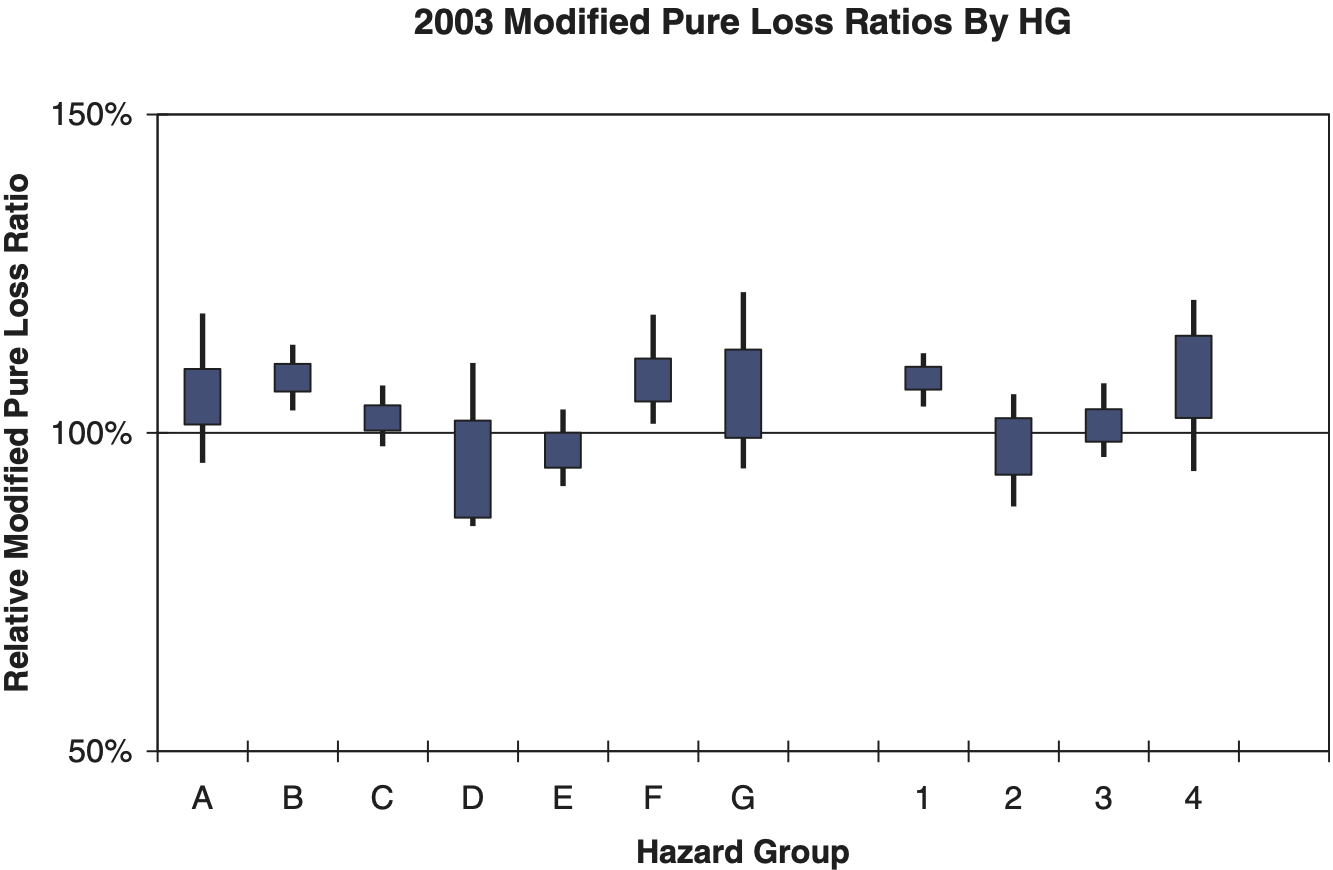
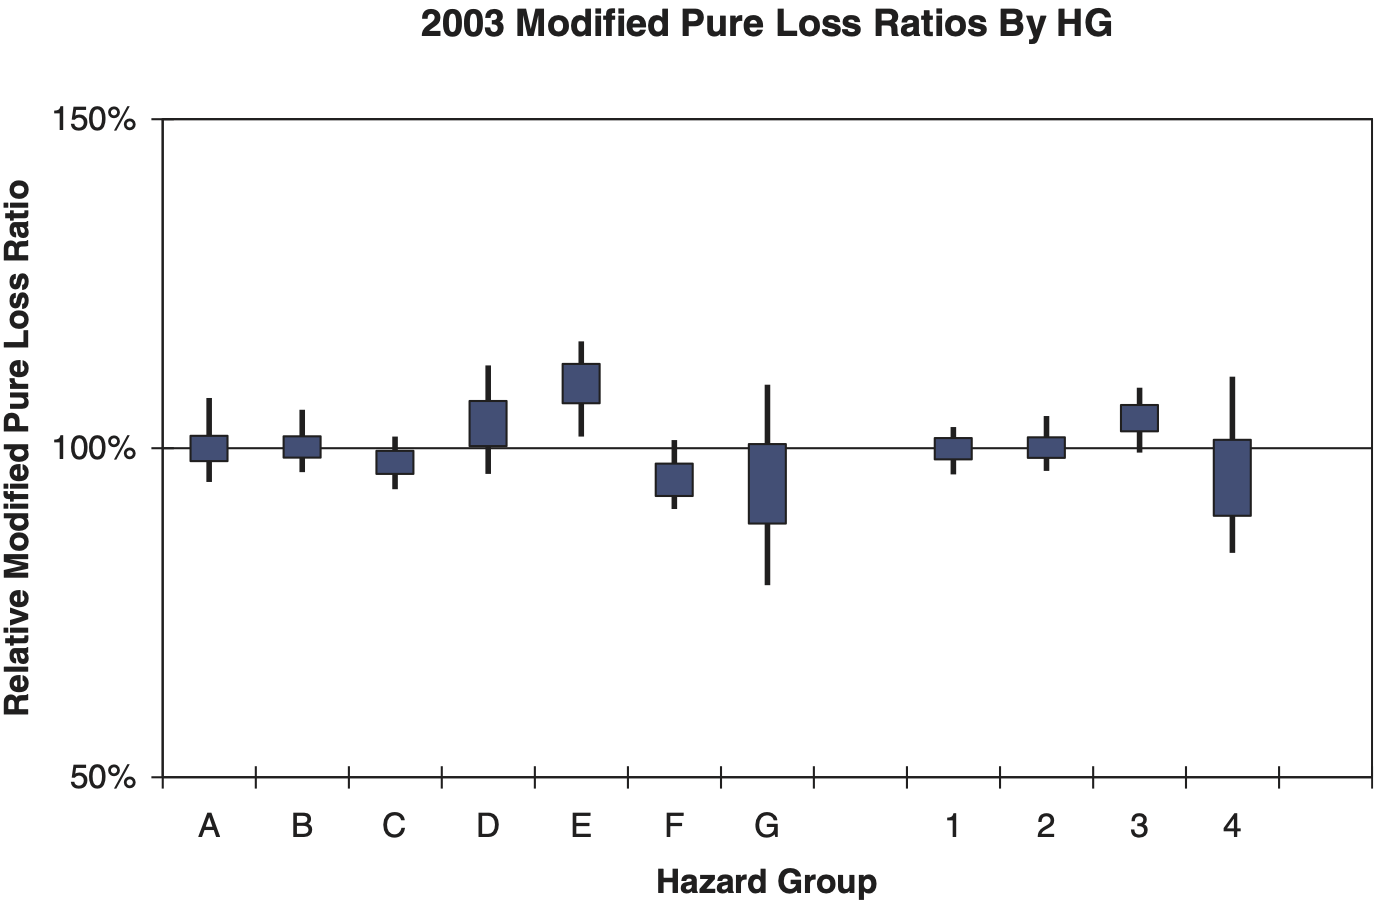
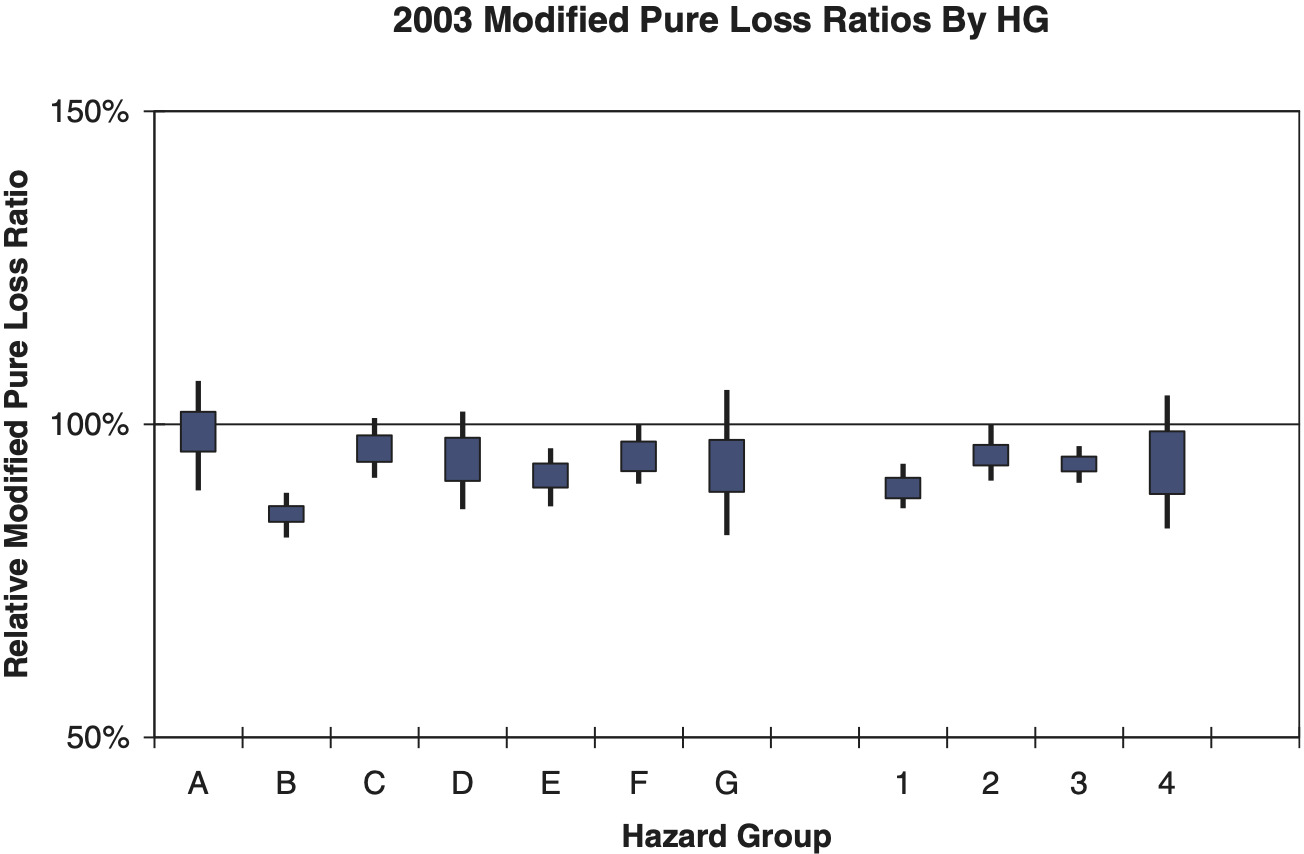
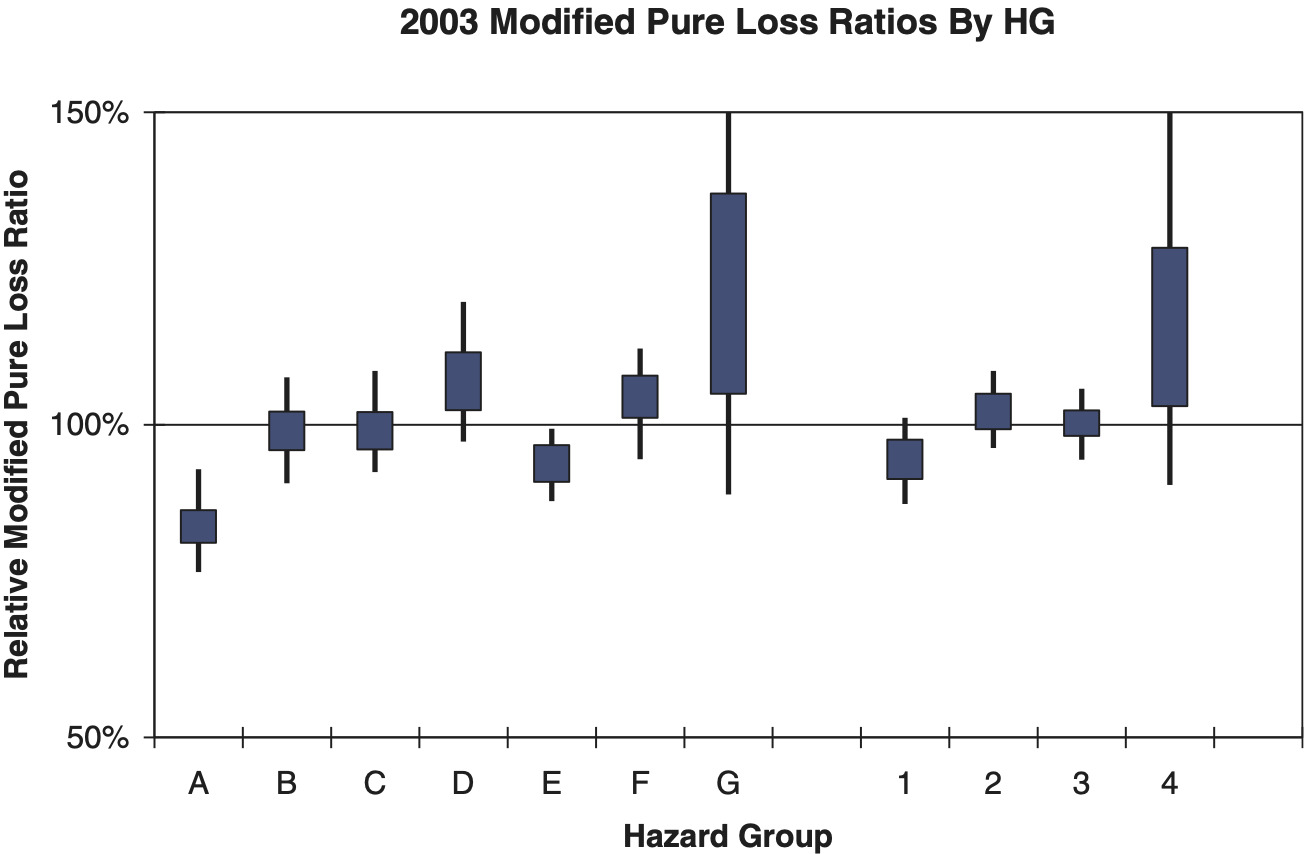
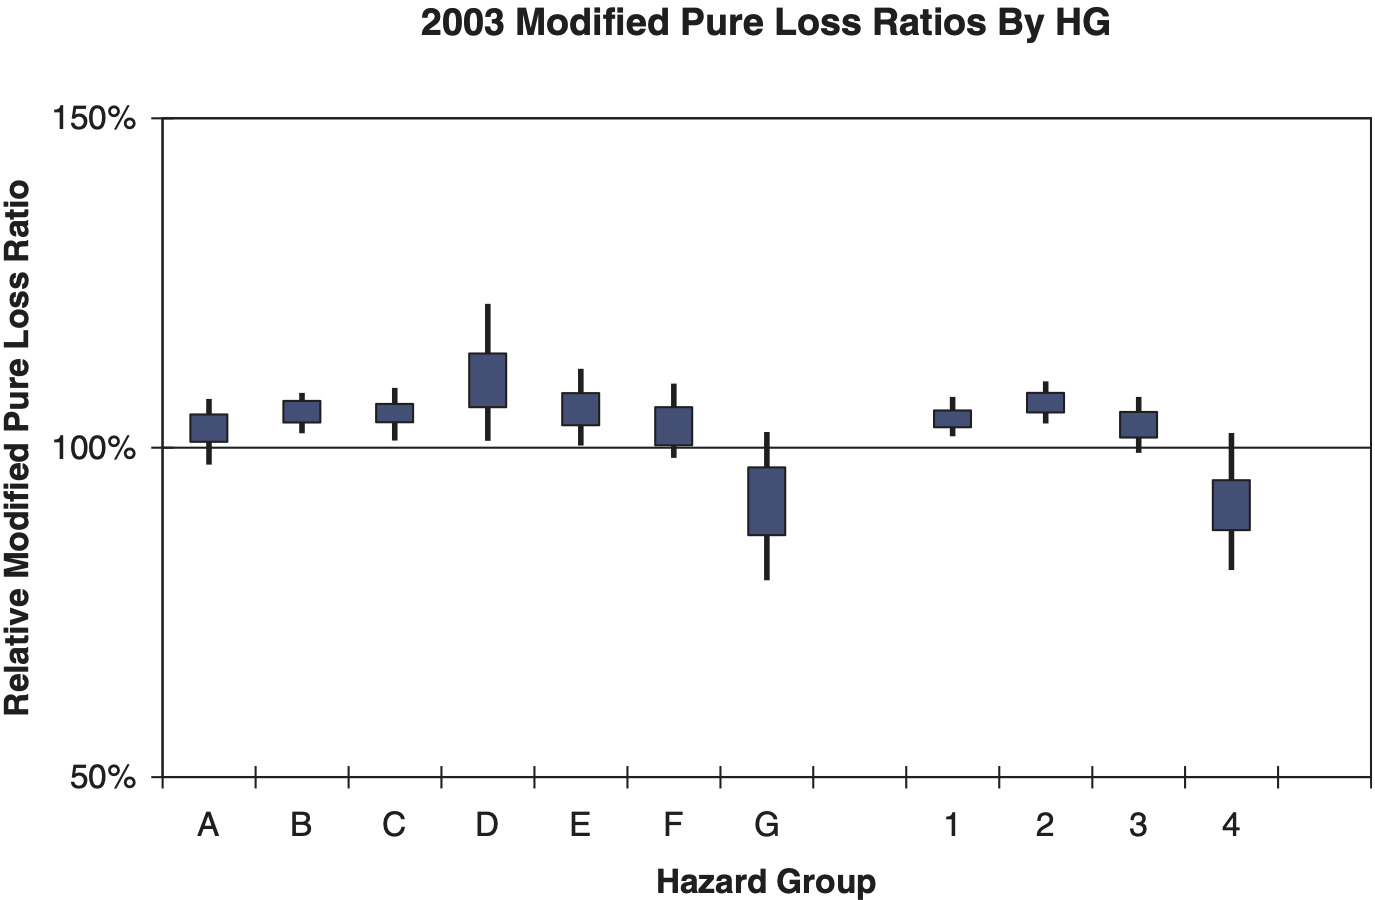
There was some concern that performance might be unequal between risks in different hazard groups. Hazard groups are a partition of employment classifications to reflect claim severity. For quintile testing purposes, risks were “assigned” to hazard groups according to the classification which generated the largest manual premium. Quintile testing demonstrated that performance was effectively uniform across hazard groups (Figures 7–11). Although performance was uniform, there were some differences in the average mods between hazard groups, such as a general decrease in average mod with increasing hazard group. These differences were somewhat equalized by class ratemaking changes, not directly part of the ER review, in how ELRs and D-ratios are calculated.


A more immediate concern arose due to changes in class ratemaking that affected the ELR and D-ratio calculations and were being implemented simultaneous to the ER review (Daley 2009). These changes primarily consisted of the consolidation of non-serious and serious indemnity partial pure premiums into a single indemnity partial pure premium, calculation of loss development factors using losses limited at 500k, the use of excess loss factor (ELF) derived excess loss provisions instead of provisions based on spreading actual excess losses, and the shift from four to seven hazard groups. Significant changes were made to the ELR and D-ratio calculations to accommodate changes to class ratemaking, as described in Sections 3.3 and 3.4.
2.1.4. Credibility
The performance of credibility underlying the mod is demonstrated by the patterns in the modified basis relative pure loss ratios in the quintile test (Figure 12).
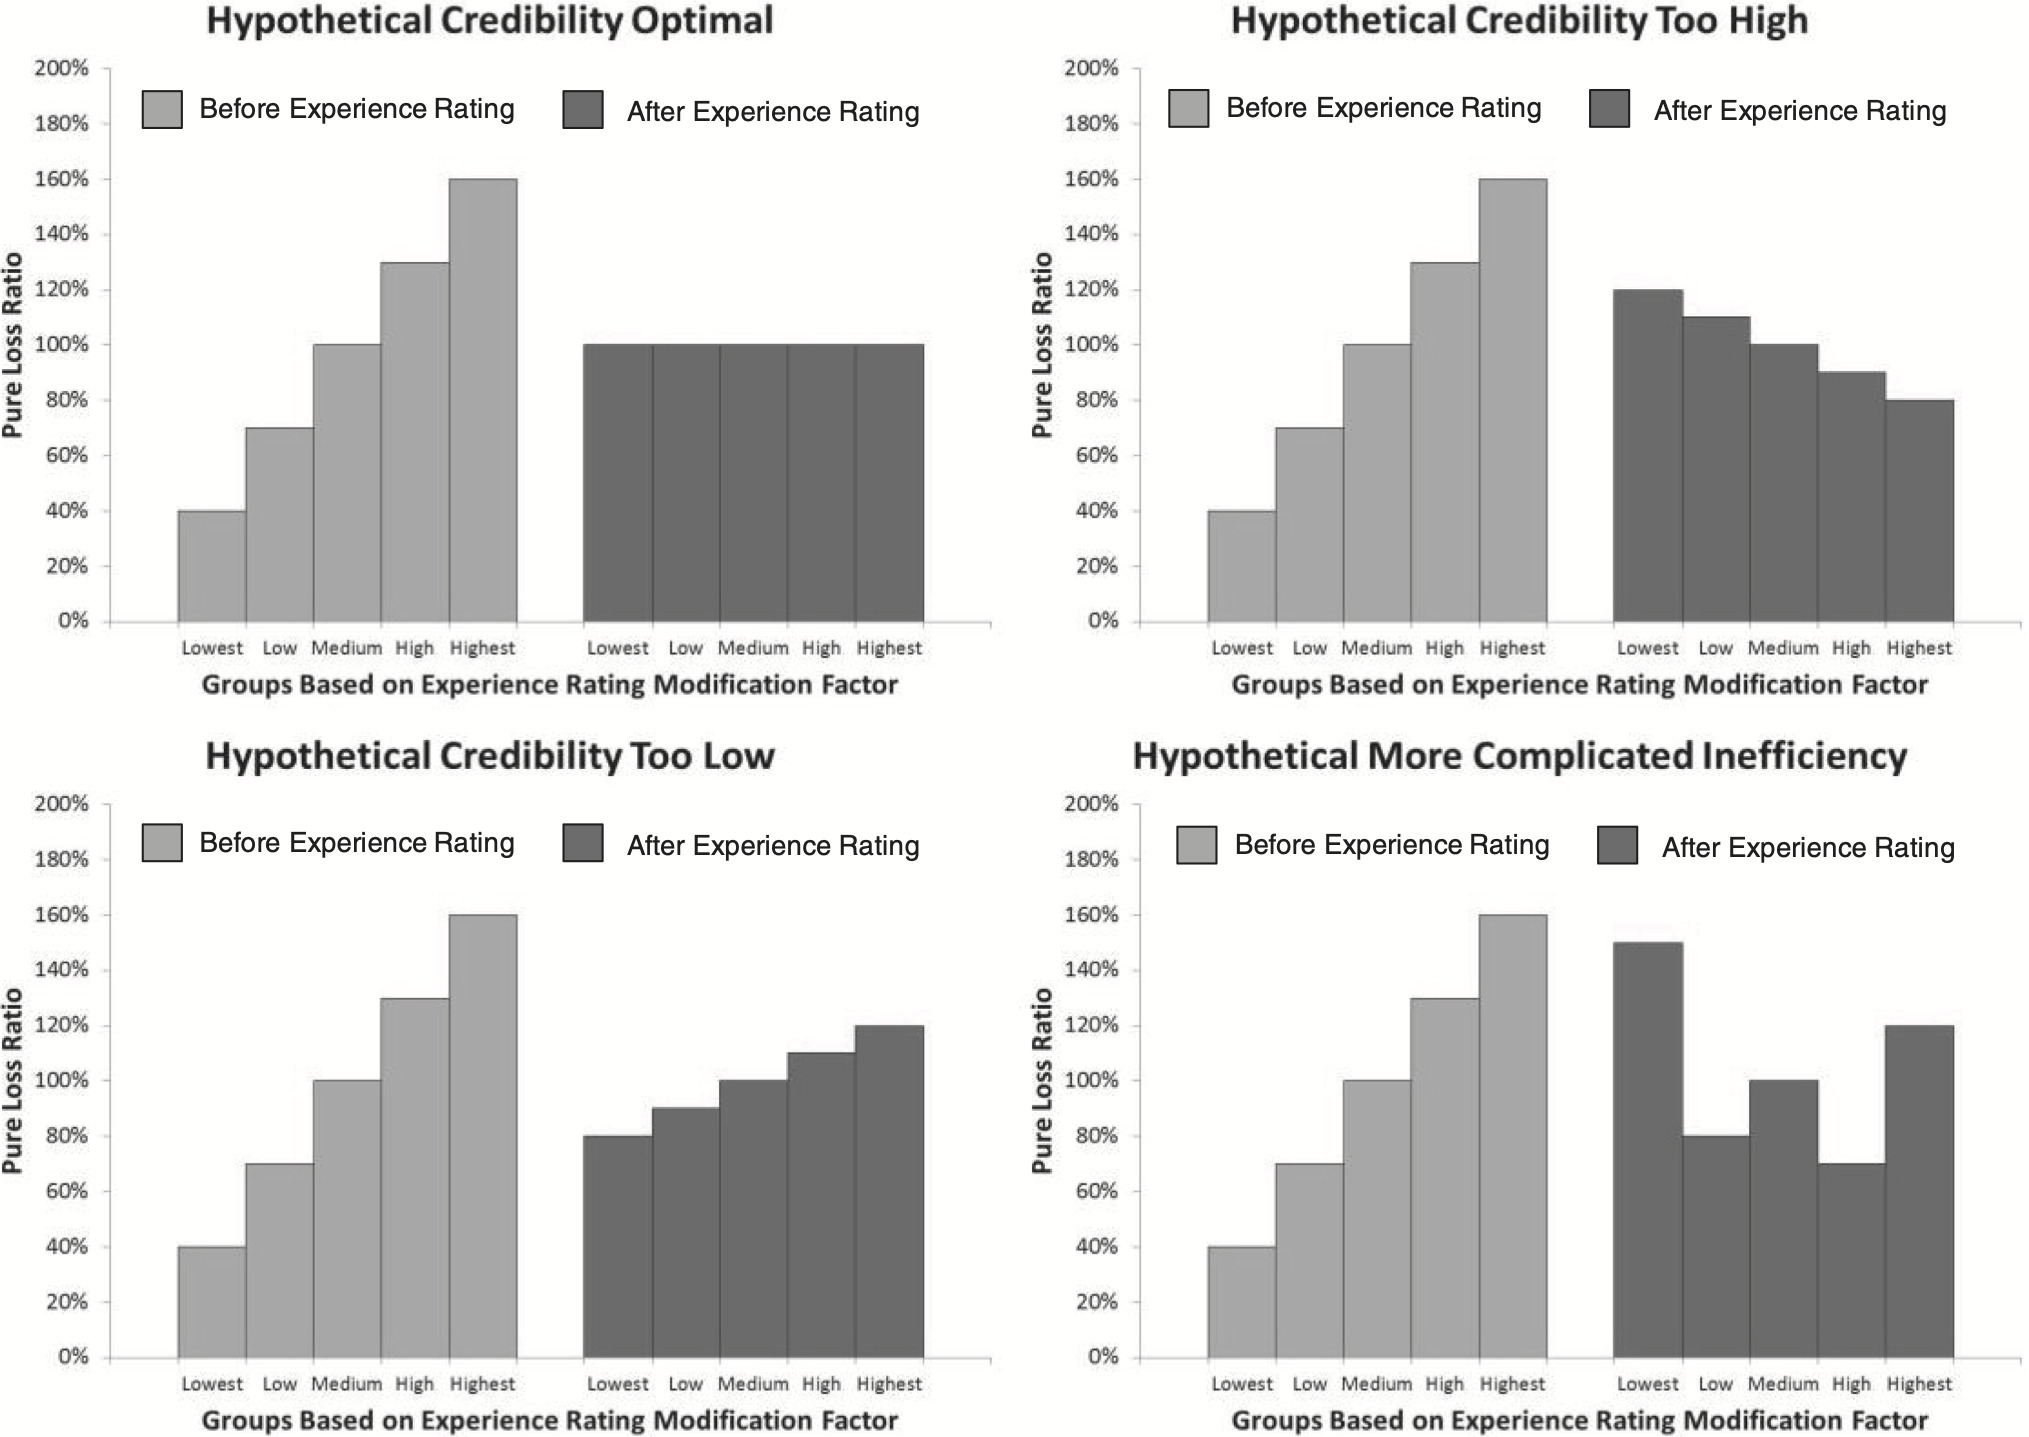
If the modified loss ratios show upward or positive “slope”, credibility is too low. Downward slope indicates credibility is too high. The quintile test was the analytical workhorse of the review and similar empirical predictive tests have always been central to experience ratemaking (Dorweiler 1934; Stevens 1959). Over the course of the review, quintile tests were performed on many specific categories, such as by state, by hazard group, by risk size, and combinations thereof, and with mods as currently calculated as well as possible alternative mod calculations. To illustrate the credibility of a quintile test, a particular concern in categories with sparse data, bootstrap-derived confidence intervals around the relative pure loss ratios (Figure 1) were usually presented instead of point estimates.
In recent years quintile testing began to show slight upward slope (Figure 1). As previously noted, this was ultimately diagnosed to be a consequence of the split point remaining fixed while severity had increased dramatically (Figure 2).
The review did explore several different alternative models (rank correlation criteria, Generalized Linear Models, etc.) to the underlying parameterization of the weight and ballast credibility values. These alternatives were challenging to implement, particularly with regard to handling credibility differences by size of risk, a consideration that is well handled through parameter and process assumptions underlying the current parameterization model (Gillam 1992a; NCCI 1998). An additional concern was that changes in ELRs and D-ratios resulting from class ratemaking changes would not be available in data for credibility fitting purposes for some years in the future. Ultimately, NCCI determined that current parameterization worked well when the indexation updates were fully implemented. Since the indexation of weights, ballasts, and the State Accident Limit were automatically tied to routine rate filings they had kept up, but the split point had fallen behind.
Quintile testing that maintained the underlying credibility parameterization for alternative split points was performed. Two numerical statistics were calculated. The “Old Quintile Statistic” measures the degree to which the modified pure loss ratios are uniform; this statistic should be as small as possible. The “New Quintile Statistic” measures the amount of manual loss ratio variation eliminated by applying the mod; this value should be as big as possible. Review of these statistics suggested that by Policy Year 2006 the optimal split point, where the old statistic tended to be lowest and the new statistic tended to be highest, was likely slightly higher than $10,000 (Figure 13, Table 2 and 3). Severity trends subsequent to the Policy Year 2006 pointed to an optimal split point that would reach upwards of $15,000 sometime in the years following Policy Year 2011.
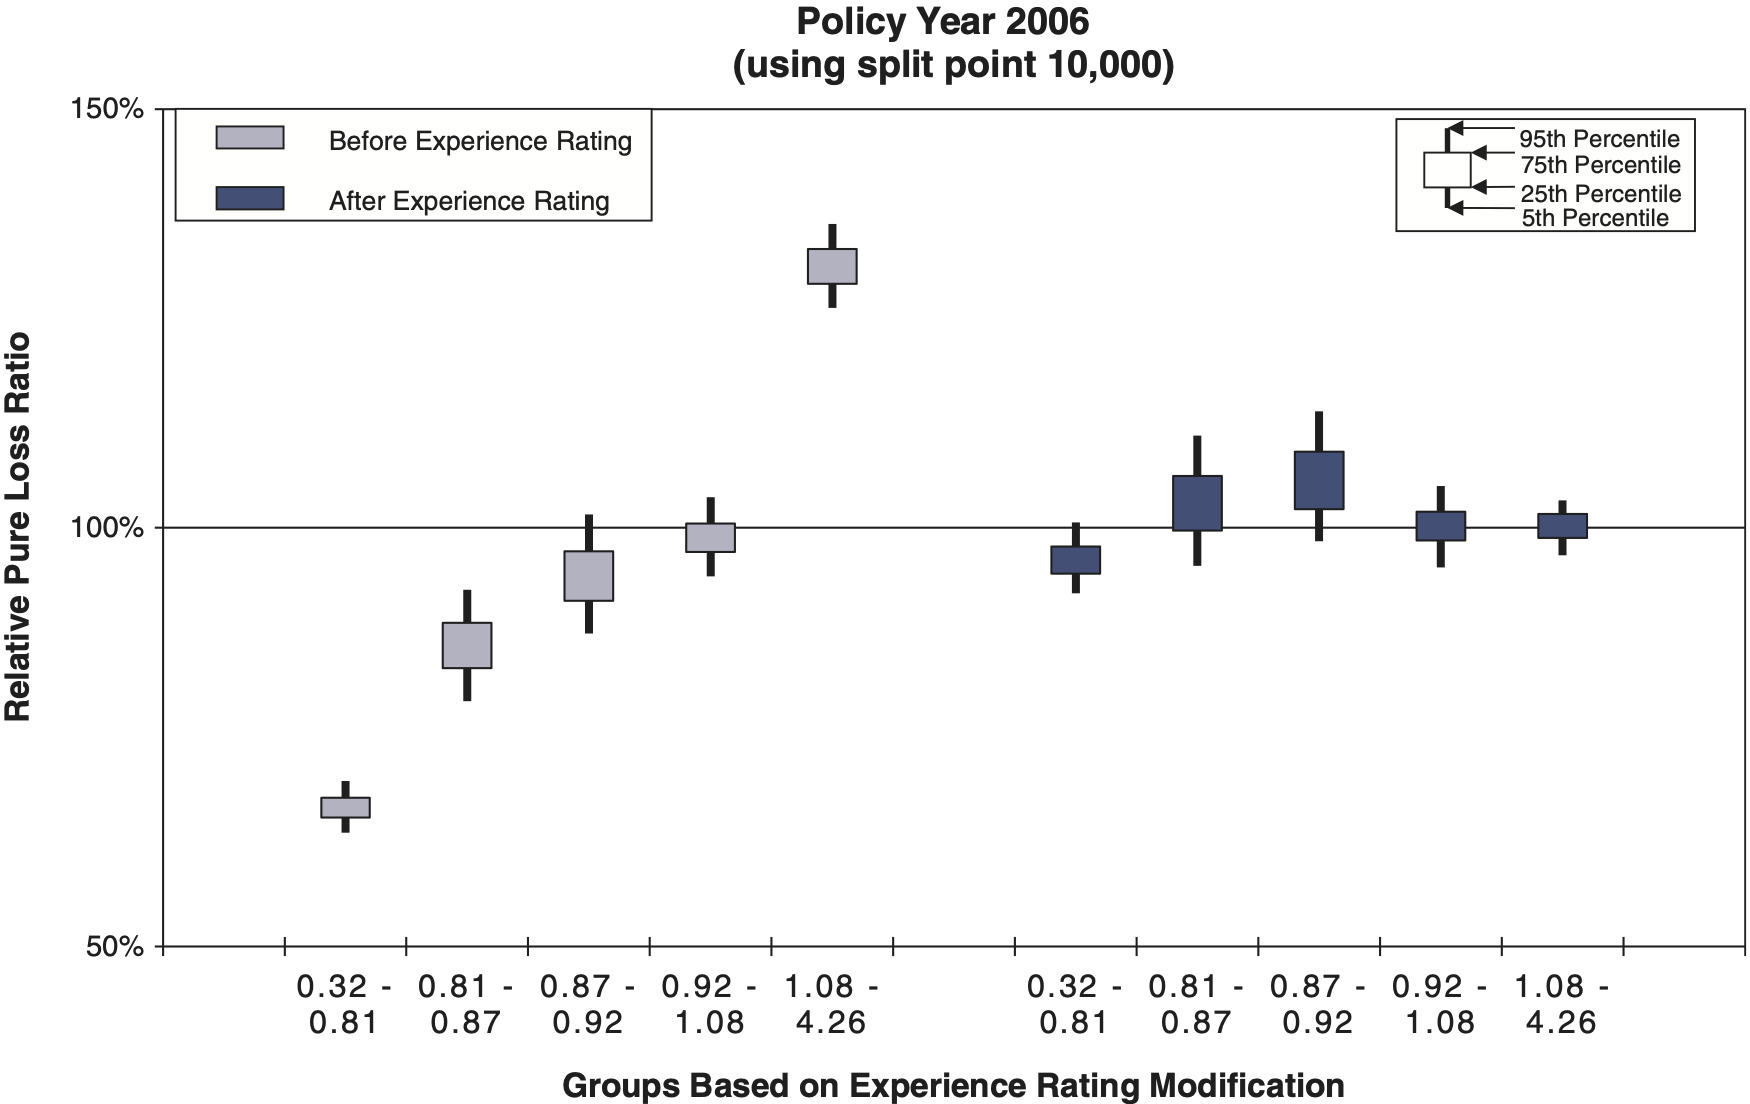
Note, the relative pure loss ratios after experience rating are flatter with the $10,000 split point (Figure 13) than with a $5,000 split point (Figure 1), which shows a slight upward slope. Similar quintile test charts were produced corresponding to the split point and risk size combinations (Table 2 and 3) and were reviewed. The results were generally consistent with the hypothetical charts (Figure 13). There was a slope pattern after experience rating that increased upward as the split point was lowered and equivalently decreased downward as the split point was decreased.
Another aspect of credibility is the minimum threshold for experience rating by size of risk. Credibility and the cap on the maximum mod both decrease with decreasing risk size. For very small risks, the variation in modified premium versus manual premium is small enough that it makes experience rating impractical for these risks.
The minimum premium threshold table was set in the early 1980s, with only a few minor changes since, to correspond to roughly 10 employees based on state average weekly wages and the state average rate level. To be eligible for experience rating, subject premium for the experience period either exceeds Column A for the most recent 24 months or average annual subject premium for the entire experience period exceeds the Column B level in the threshold table (Table 4). The current thresholds are much lower in real dollars than when established in the 1980s.
Severity indexation would be more desirable from a credibility standpoint since it would imply a standard of a minimum expected number of claims. Based on review of the pervasive use of severity indexation in other parts of the plan, it would be desirable for consistency and simplicity to use severity indexation for the eligibility threshold also. In the review, NCCI explored several different possible severity index based standards for eligibility. However, as of this writing (early 2014), NCCI has no specific plans regarding new eligibility thresholds.
2.2. Other findings
2.2.1. Rank versus expected loss
In the course of the review, the use of a criterion of 0% rank correlation to fit credibility values, as introduced by Glenn Meyers (1985), was explored. It became apparent that the criterion Meyers used of 0% rank correlation between modification factors and subsequent actual modified pure loss ratios was generally not consistent with the key criterion of equal expected values for subsequent modified pure loss ratios, as evidenced empirically by flat modified relative pure loss ratios in a quintile test. The high degree of departure between these two criteria was surprising and the author is preparing a separate paper for the CAS on this topic.
2.2.2. Optimal number of quantiles
Quintile testing is central to performance testing and credibility fitting for the ER Plan (Gillam 1992a; Venter 1987). A natural question arises as to why NCCI uses five quantiles (quintiles) for this purpose. The author presented an explanation of the optimal number of quantiles in terms of a “noise to signal ratio.” The key result was that this noise to signal ratio is proportional to k1.5 where k is the number of quantiles and inversely proportional to n0.5 where n is the number of risks of approximately the same size. Thus there is a tremendous penalty, in terms of data volume required, for adding more quantiles to the test. Doubling the number of quantiles requires eight times as much data to maintain the same resolution, in terms of the noise to signal ratio. The author is preparing a separate paper for the CAS on this topic.
3. Changes to the experience rating plan
Several changes emerged from the review, some having already been implemented and others pending in the near future as of this writing.
3.1. Split point
Split points of about $10,000 for Policy Year 2006 and about $15,000 for Policy Year 2013 were determined to be appropriate updates for the split point. These selections were made with consideration to both historical changes in the severity index and quintile testing. The split point was initially raised to $10,000 with further gradual changes over a three year period to reach the equivalent of $15,000 plus index changes over the intervening time. Subsequent indexation of the split point based on the countrywide Average Claim Cost will be an automatic part of NCCI’s annual rate filings.
At any given time the split may vary by state due to differences in the schedule of rate filings by state, but will generally coincide when all of the seasonal filings have been made and before the next filing season.
3.2. Mod cap
The previous mod cap formula was (3.1)
1+0.00005(E+2E/G)
where E is experience period expected losses and G is the G value form of the severity index (see Section 2.1.1). This was updated to (3.2).
1.10+0.0004(E/G)
This new formula will allow slightly more room for debit mods on the smallest risks. The new formula is also entirely a function of implied expected number of claims (E/G ∼ expected losses/average severity expected claim counts) between states and over time, whereas the previous formula was partially dependent on the absolute value of expected losses.
3.3. D-ratio calculation
Part of NCCI’s recent revision of class ratemaking methods involved a shift from the three categories of partial pure premiums (serious indemnity, non-serious indemnity, and medical) to only the two categories of indemnity and medical (Daley 2009). Partial D-ratios had been calculated for each premium component statewide and then weighted by the partial premiums in each class to produce the class D-ratio. To compensate for this loss of refinement, the new partial D-ratios for medical and indemnity losses were estimated separately for each hazard group. Since D-ratio factors should tend to decrease for higher hazard groups, a monotonicity smoothing algorithm was applied to indicated D-ratio factors. This smoother iterates several times, averaging a D-ratio factor with factors in the adjacent hazard group(s) in cases where a factor is lower than the factor in the adjacent higher hazard group and/or higher than the factor in the adjacent lower hazard group.
3.4. ELR calculation
The Expected Loss Rates (ELRs) are applied to experience period payrolls to calculate expected ratable losses. One key part of the calculation of ELRs is the Excess Loss Adjustment Factor (ELAF), which removes expected losses above the State Accident Limit. The ELAF calculation had been based on some simple excess loss ratio curves for undeveloped losses by entry ratio from the 1970s (Harwayne 1976), represented in terms of quadratic and cubic polynomials for Fatal, Permanent Total, and Major Permanent Partial injury type categories. Recent NCCI Excess Loss Factors (ELF) were not well suited for this purpose as they reflect losses that are developed and stochastically dispersed to ultimate values instead of the immature values for ratable experience period losses (Corro and Engl 2006). A set of replacement excess ratio curves for the ELAFs, still represented in terms of polynomials (3.3) but fit separately to Fatal, Permanent Total, Permanent Partial, Temporary Total, and Medical Only, was fit to more recent NCCI claims data (Table 5). The new excess ratio curves, still on an undeveloped basis, were significantly higher for higher entry ratios.
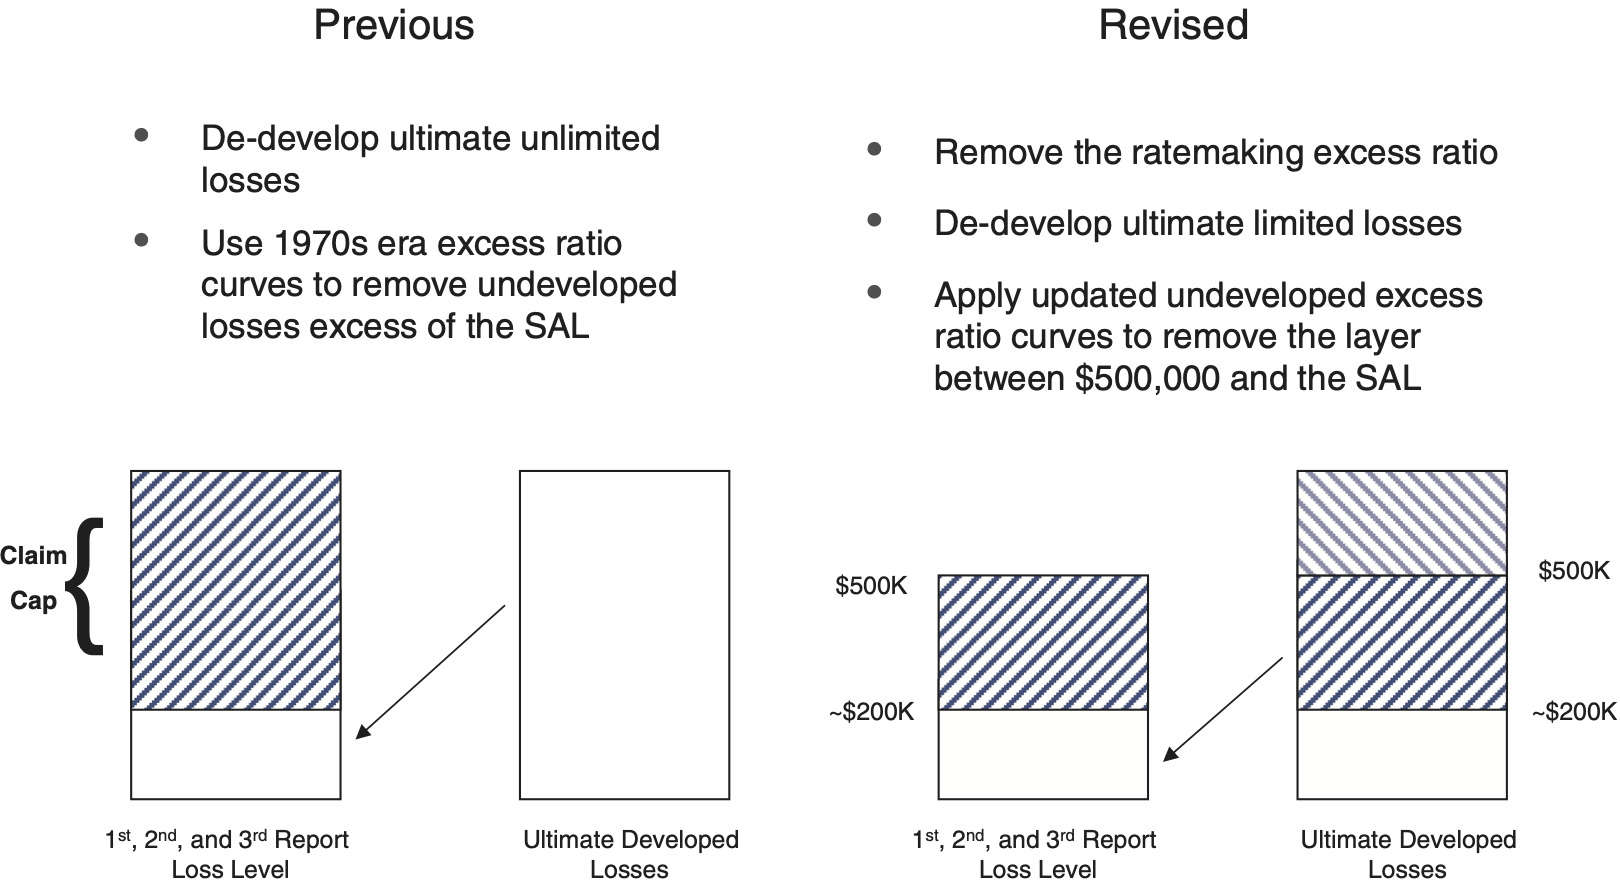
The new class ratemaking procedures use loss development of claims limited to $500k, with an excess provision derived from ELFs added to estimate ultimate unlimited losses. The previous ELAF procedure had “de-developed” ultimate expected losses and then subtracted an excess provision derived from the older undeveloped excess ratio curves. The new ELAF procedure first removes the ELF based excess provision at ultimate, de-develops losses, then subtracts an excess provision, derived from the updated undeveloped excess ratios curves, for the layer from the SAL to the 500k class ratemaking limit (Figure 14). It is worth noting that if at some point an SAL exceeds 500k, the calculation will add rather than subtract an excess layer provision, which is still actuarially sound.
E(r)= Undeveloped Excess Ratio =1ar3+br2+cr+1r= Entry Ratio
4. Conclusions
The parameterization and severity indexation scheme for credibility underlying the NCCI ER plan implemented in the 1990s has well stood the test of time. Recent performance testing indicates that experience rating continues to dramatically improve estimates of individual risk future expected losses versus the expected losses underlying the class loss costs. However, the indexation of parameters has lagged with regard to the split point, leading to a gradual deterioration of performance over time due to the resulting low credibility.
There is value to simple representation and presentation of the components of the ER formula even when such simplicity does not materially affect the actual calculation. Such simplicity facilitates understanding on the part of the many people over many years in many different circumstances who must deal with the formula.
Acknowledgments
In addition to the author, many other members of NCCI Staff contributed significant work to the review. A notable, but not exhaustive, list of major contributors includes Ampegama Perera, Tom Sheppard, Chris Poteet, Tony DiDonato, Barry Lipton, Melissa Brown, Anna Elez, and Meghan Gaier. Members of the Individual Risk Rating Working Group employed by NCCI affiliates contributed time and feedback through their attendance at dozens of meetings, held approximately quarterly during the course of the review from August 2006 through February 2011.
Abbreviations and notations
ACC, Average Cost Per Case
Ae, Actual Excess Ratable Loss From Experience Period
Ap, Actual Primary Ratable Loss From The Experience Period
B, Ballast Value
C, Multiple of SACC Used for Eligibility Threshold
CAS, Casualty Actuarial Society
CPI, Consumer Price Index
D, D-ratio
E, Experience Period Expected Ratable Loss
E(r), Undeveloped Excess Loss Ratio
Ee, expected excess ratable loss from experience Period
Ep, Expected Primary Ratable Loss From The Experience Period
ELAF, Excess Loss Adjustment Factor
ELF, Excess Loss Factor
ELR, Expected Loss Rate
ER, Experience Rating
ERA, Experience Rating Adjustment
G, G Value
GERT, Graduated Experience Rating Tables
HG, Hazard Group
IRRWG, Individual Risk Rating Working Group
k, Number of Quantiles
Mod, Experience Rating Modification Factor
n, Number of Risks in Data
NCCI, The National Council on Compensation Insurance
PCAS, Proceedings of the Casualty Actuarial Society
PY, Policy Year
r, Entry Ratio
RERP, Revised Experience Rating Plan
SACC, State Average Cost Per Case
SAL, State Accident Limit
SAWW, State Average Weekly Wage
SRP, State Reference Point
TX, Texas
W, Weight Value
WCSP, Workers Compensation Statistical Plan
y, Implied Expected Number of Claims
Ze, Excess Credibility
Zp, Primary Credibility