


1. Introduction
In the late 2000s, National Council on Compensation Insurance (NCCI) modified the methodology used to determine class pure premiums for workers compensation insurance. The new methodology was filed in NCCI states’ loss cost filings beginning October 1, 2009. Key changes made that are covered in this paper are (1) a new method for developing losses to ultimate value and (2) a new method for handling large claims. The class ratemaking methodology was last modified with some minor changes in 1993, which were (a) the number of policy periods used in determining pure premiums for each class was increased from three to five, (b) the underlying class credibility formulae were modified, and (c) the number of industry groups used for targeting class loss cost changes was increased from three to five.
The following topics are referenced in this paper but not covered in detail:
-
The methodology to determine the change in a state’s overall indicated loss cost level
-
The new methodology for mapping class codes to the seven hazard groups
-
The methodology underlying excess loss factors
-
The derivation of a loss cost for a class code
Many of my colleagues at NCCI made significant contributions to the success of this huge undertaking and are duly mentioned in the acknowledgment. This could not have been possible without their valuable insights, hard work, and support.
2. Background and Methods
The motivation underlying the applied research approach is:
-
To improve the equity of loss costs across class codes
-
To improve year-to-year stability of loss cost changes by class code
-
To explore the potential use of new data elements which NCCI began collecting in the 1996 Unit Report Expansion (URE)
2.1. Availability of new URE data elements
The source data used for class ratemaking is the Workers Compensation Statistical Plan (WCSP) data (a.k.a., Unit Statistical Plan). Most NCCI states approved the collection of the URE data elements in 1996. The first complete policy period available in most states is policy year 1997. Some states did not approve the collection of URE data in their state for a few more years (the last state was approved in 2002). Thus, in a few states, the database is less complete historically, adding further to the challenges of our research agenda.
Data historically collected in the WCSP includes the employer’s payroll and indemnity and medical case incurred losses by claim by injury type (e.g., fatal, permanent total, permanent partial, temporary total, and medical only). Some, but not all, of the URE data elements reported to NCCI by carriers are:
-
Paid allocated loss adjustment expense (ALAE; case reserves were optional)
-
Paid losses separate from “paid + case” losses
-
Injured Part of Body
-
Nature of Injury
-
Cause of Injury
-
Deductible Reimbursement Amounts
-
Lump Sum Indicator
Effective with policy period 1999 and subsequent, carriers began mandatory reporting to NCCI all URE data elements and WCSP data elements beyond a fifth report, up to and including a tenth report.
2.2. Overview of the methodology changes
Significant changes to the NCCI class ratemaking were implemented in the following six areas:
-
Loss development factors (LDF) are derived using claim characteristics such as injured part of body, the open and closed claim status at first report, and the injury type category.
-
The loss development triangles are being expanded from five reports out to, eventually, 10 reports.
-
Large claims will be capped at $500,000 and expected excess factors (derived from the new seven hazard group mapping by class code) will be used to calculate ultimate losses.
-
Serious and non-serious partial pure premium components were eliminated, and replaced by one indemnity pure premium component.
-
The computation of the indicated losses within the industry group differential calculation was modified to include the new loss development approach.
-
The full credibility standards for indicated and national pure premiums were modified.
This paper does not cover the credibility standards.
2.3. Background: The prior loss development approach
Understanding the nuances of the former approach will help the reader gain a better appreciation for the reasoning behind the newly implemented changes to loss development. The previous approach to determine LDFs for class ratemaking was to segregate the dollars of loss generated from claims into two loss development categories. They were (a) the serious grouping and (b) the non-serious grouping. An arbitrary dollar value, referred to as the critical value, which varied significantly by state, was determined for each state’s loss cost filing. All permanent partial claims whose indemnity dollar amount exceeded the critical value, as measured on a “paid + case” basis, were categorized into the serious grouping and referred to as major permanent partial claims. This was done to provide a greater volume of serious losses to derive LDFs.
In workers compensation, different levels of indemnity benefits are paid based upon the injury types: fatal (Fa), permanent total (PT), permanent partial (PP), temporary total (TT), and medical only (MO).
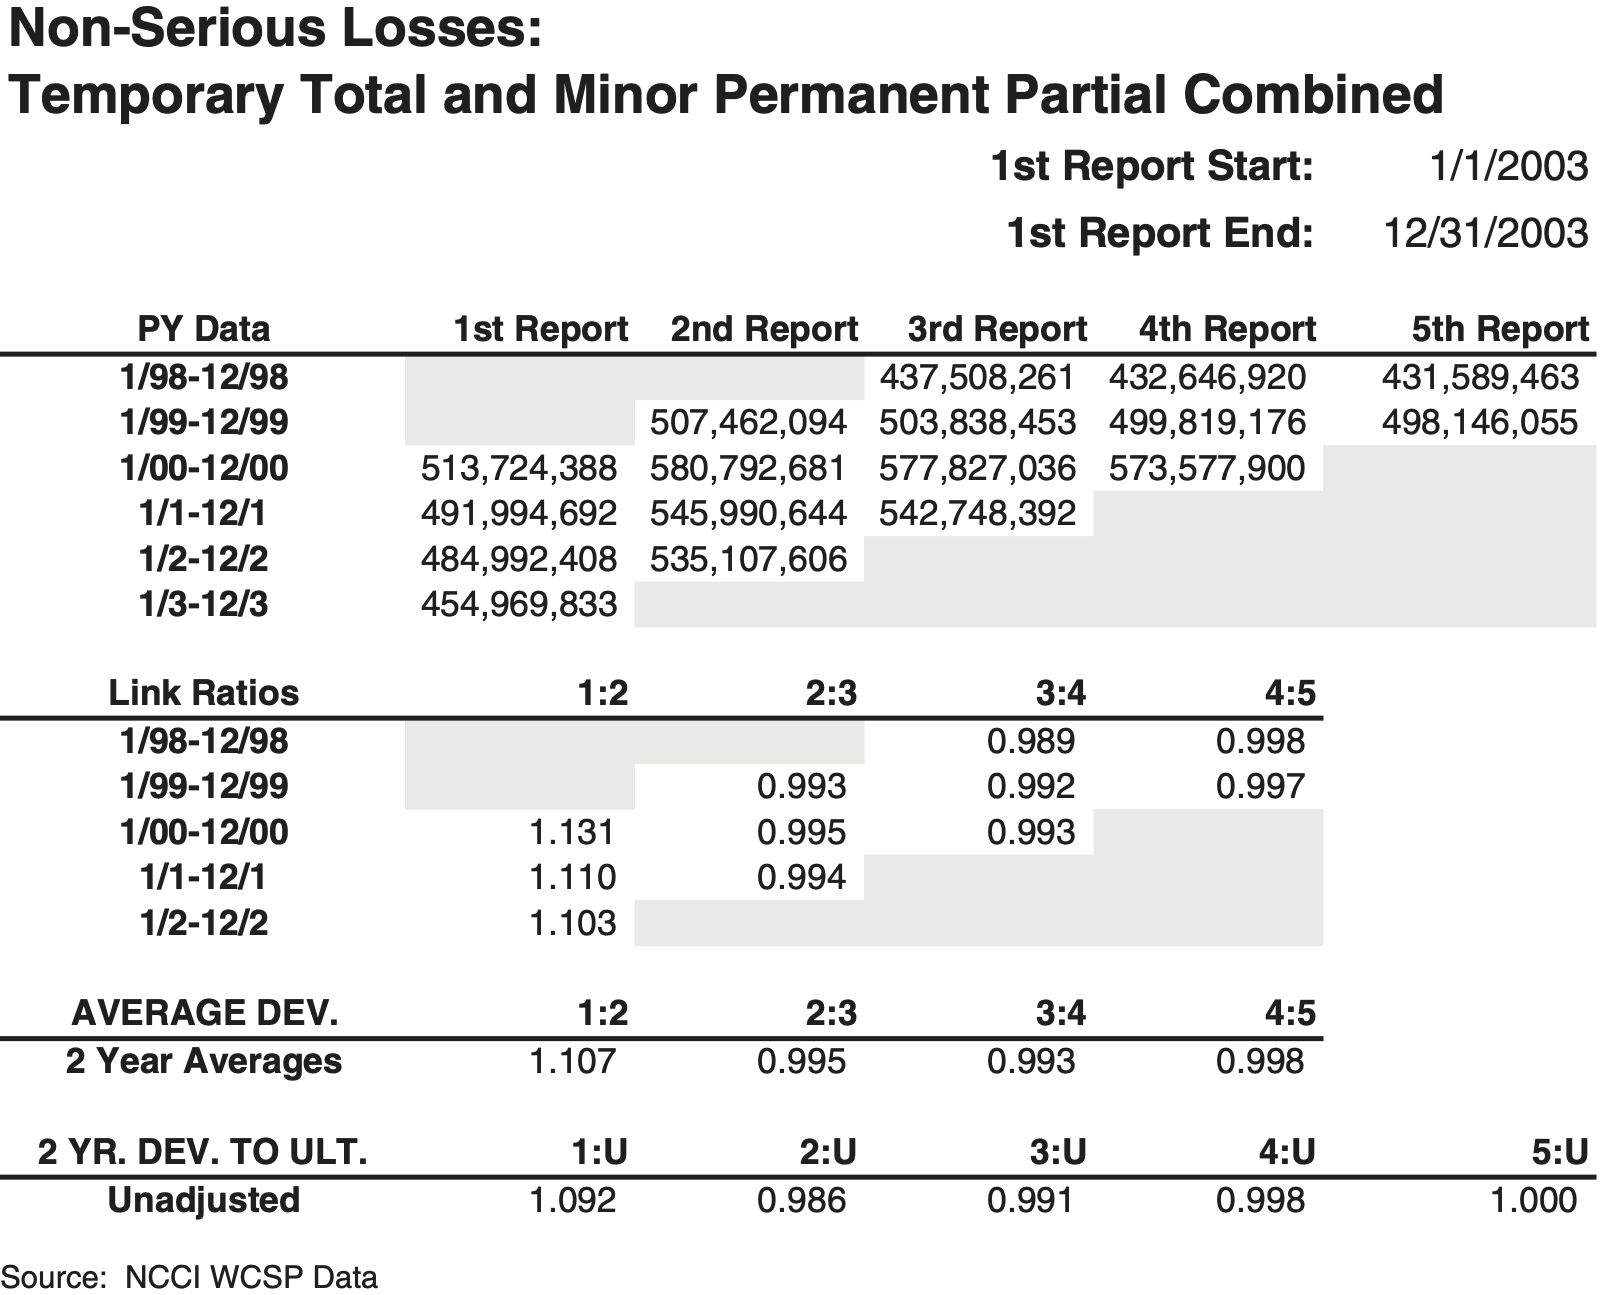
For each state, four loss development triangles were compiled from the WCSP data using unlimited “paid + case” losses associated with claims across five policy periods. The four triangles consisted of indemnity and medical, each having a serious and non-serious component. LDFs were unlimited in the prior methodology. Figures 1a and 1b illustrate how the injury types were formerly mapped and the typical indemnity loss development pattern:
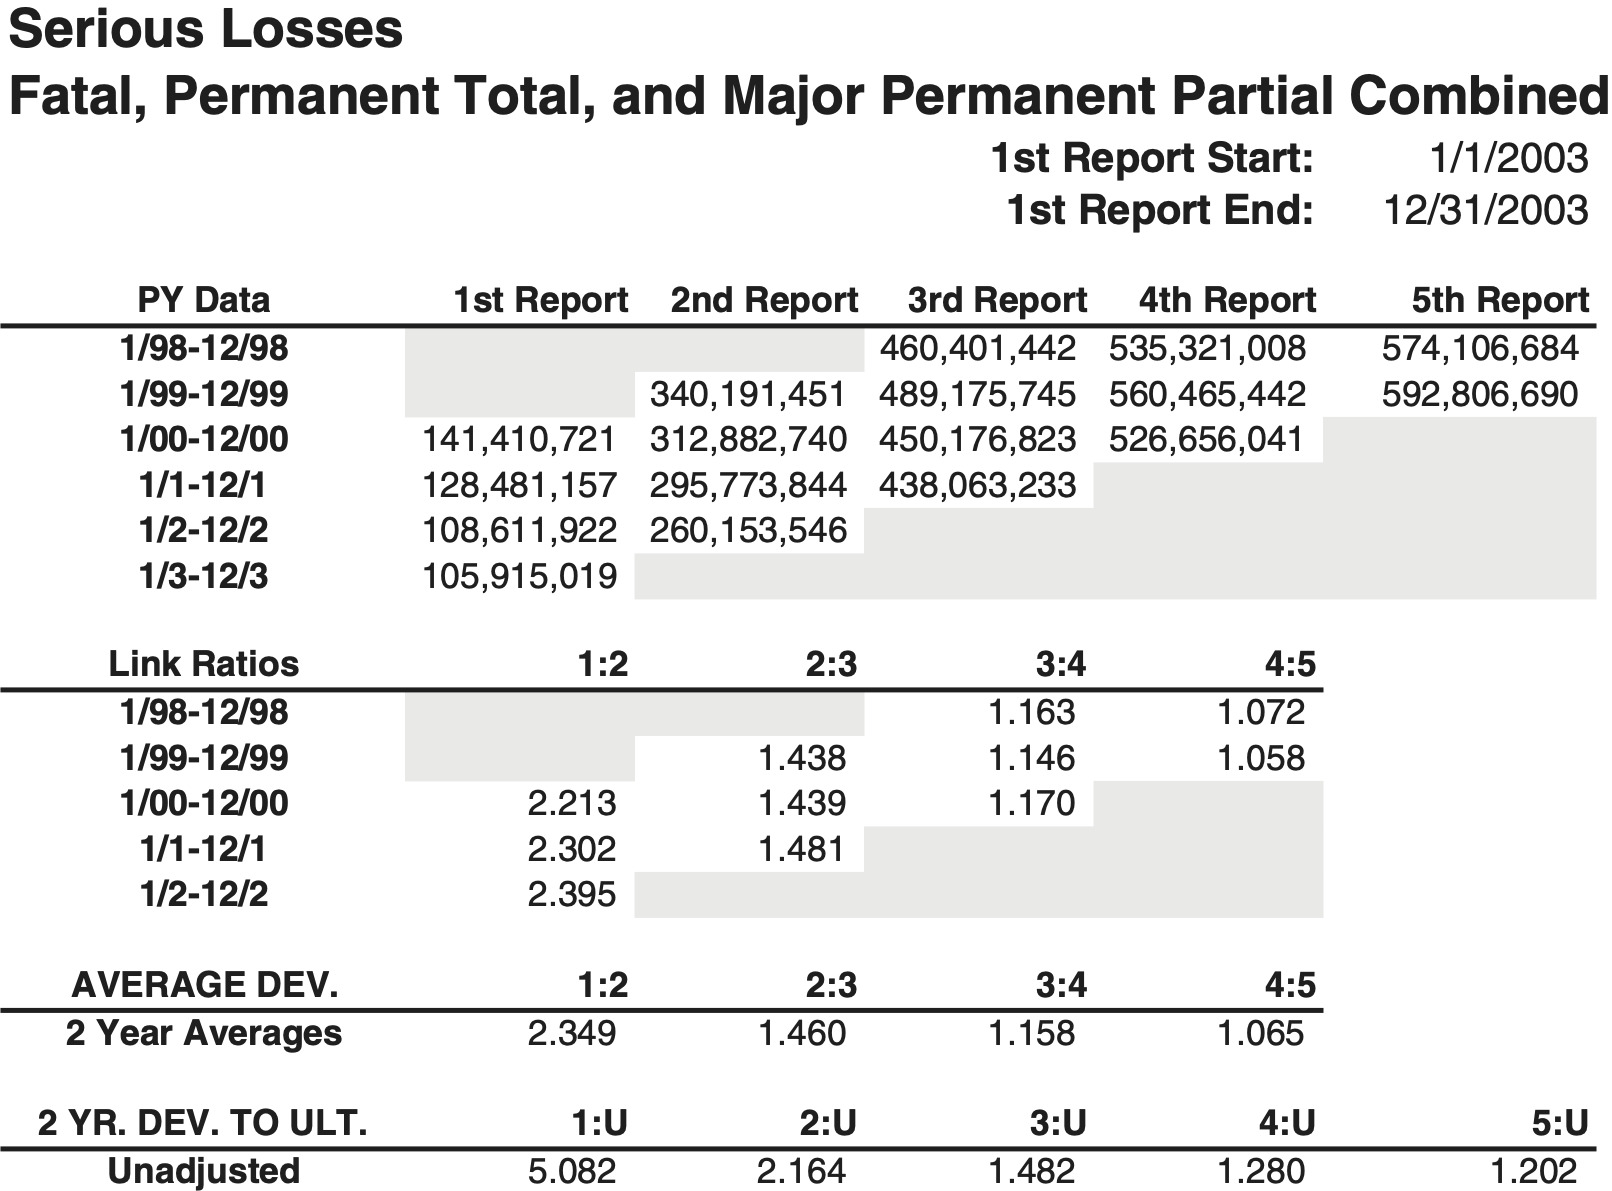
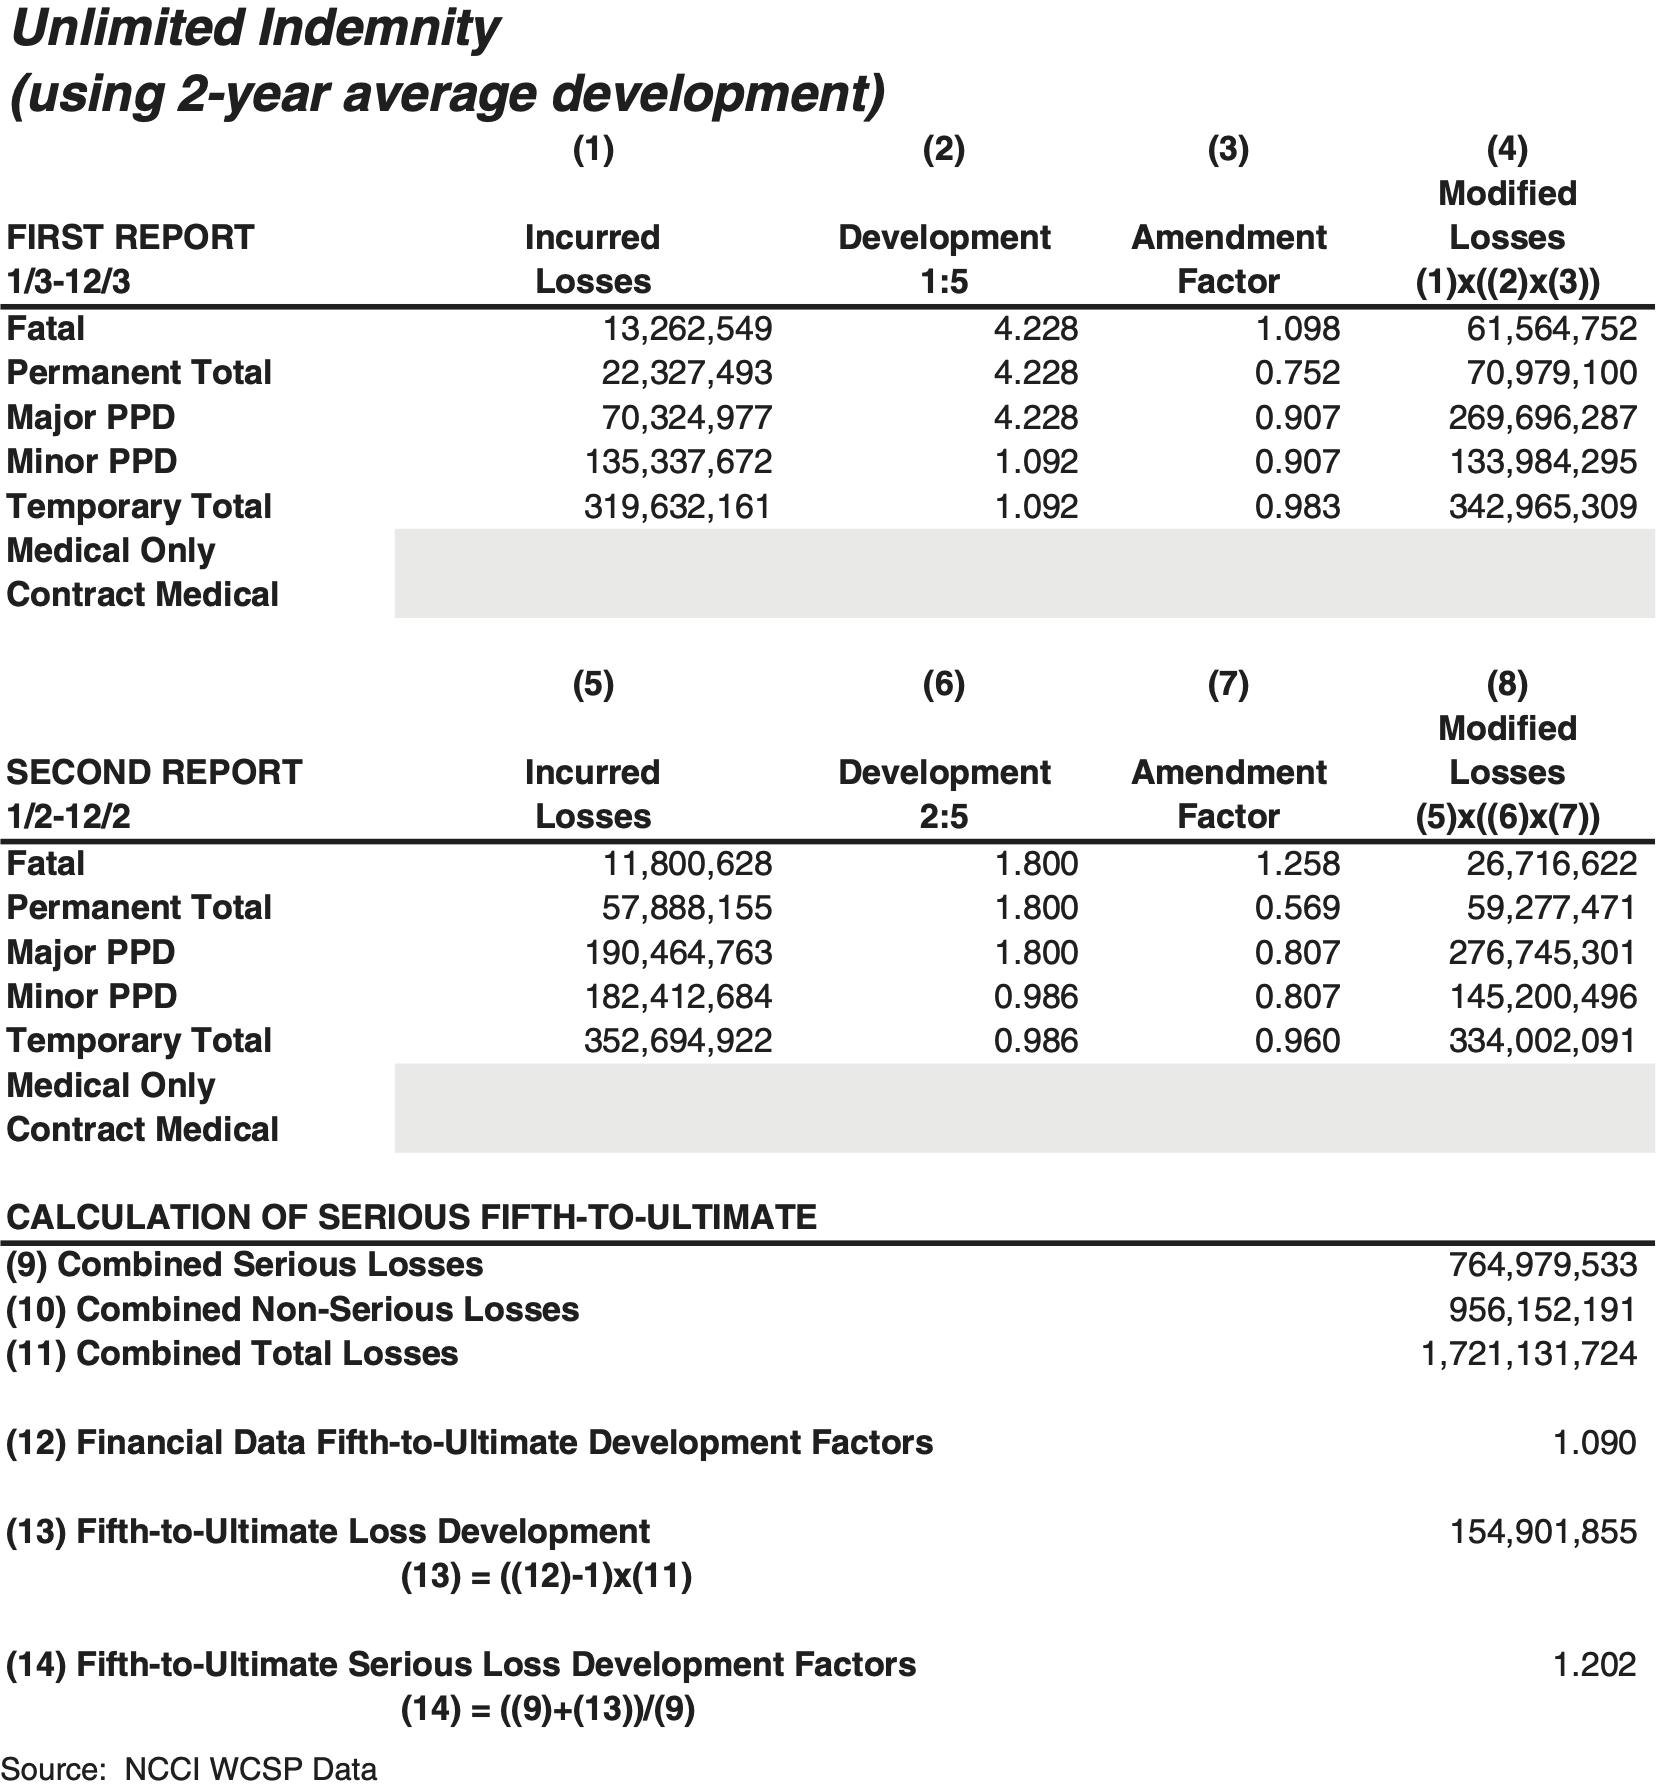
The losses were evaluated at first through fifth report (@18, @30, @42, @54, and @66 months, respectively). A tail factor was applied to the serious loss development triangles only and was derived from NCCI financial call data used in the overall aggregate loss cost indication for the state. It was assumed that all loss development beyond fifth report was generated by serious claims only. Balancing to the financial data tail, a large tail factor was applied to the serious losses to generate a fifth-to-ultimate LDF, while a tail factor of unity was applied to the non-serious losses. An illustration of the prior tail factor derivation is shown in Figure 2.

The prior loss development approach had five shortcomings:
-
Claim severity was not a good indicator of the propensity of a claim to develop in the future.
-
As claims matured, many would “crossover” the critical value at subsequent reports, and be reassigned into the serious grouping, or vice versa.
-
Critical value crossover distorts the predictive ability of the LDFs in the serious and non-serious triangles.
-
The medical dollar amount was ignored in determining whether or not a claim was categorized as serious or non-serious.
-
No distinction between serious and non-serious loss dollars was made within the medical loss triangles from first through fifth report (i.e., total medical was used). However, a fifth-to-ultimate medical tail factor was applied to the total medical loss dollars associated with the serious lost-time claims.
2.4. The problem of critical value crossover
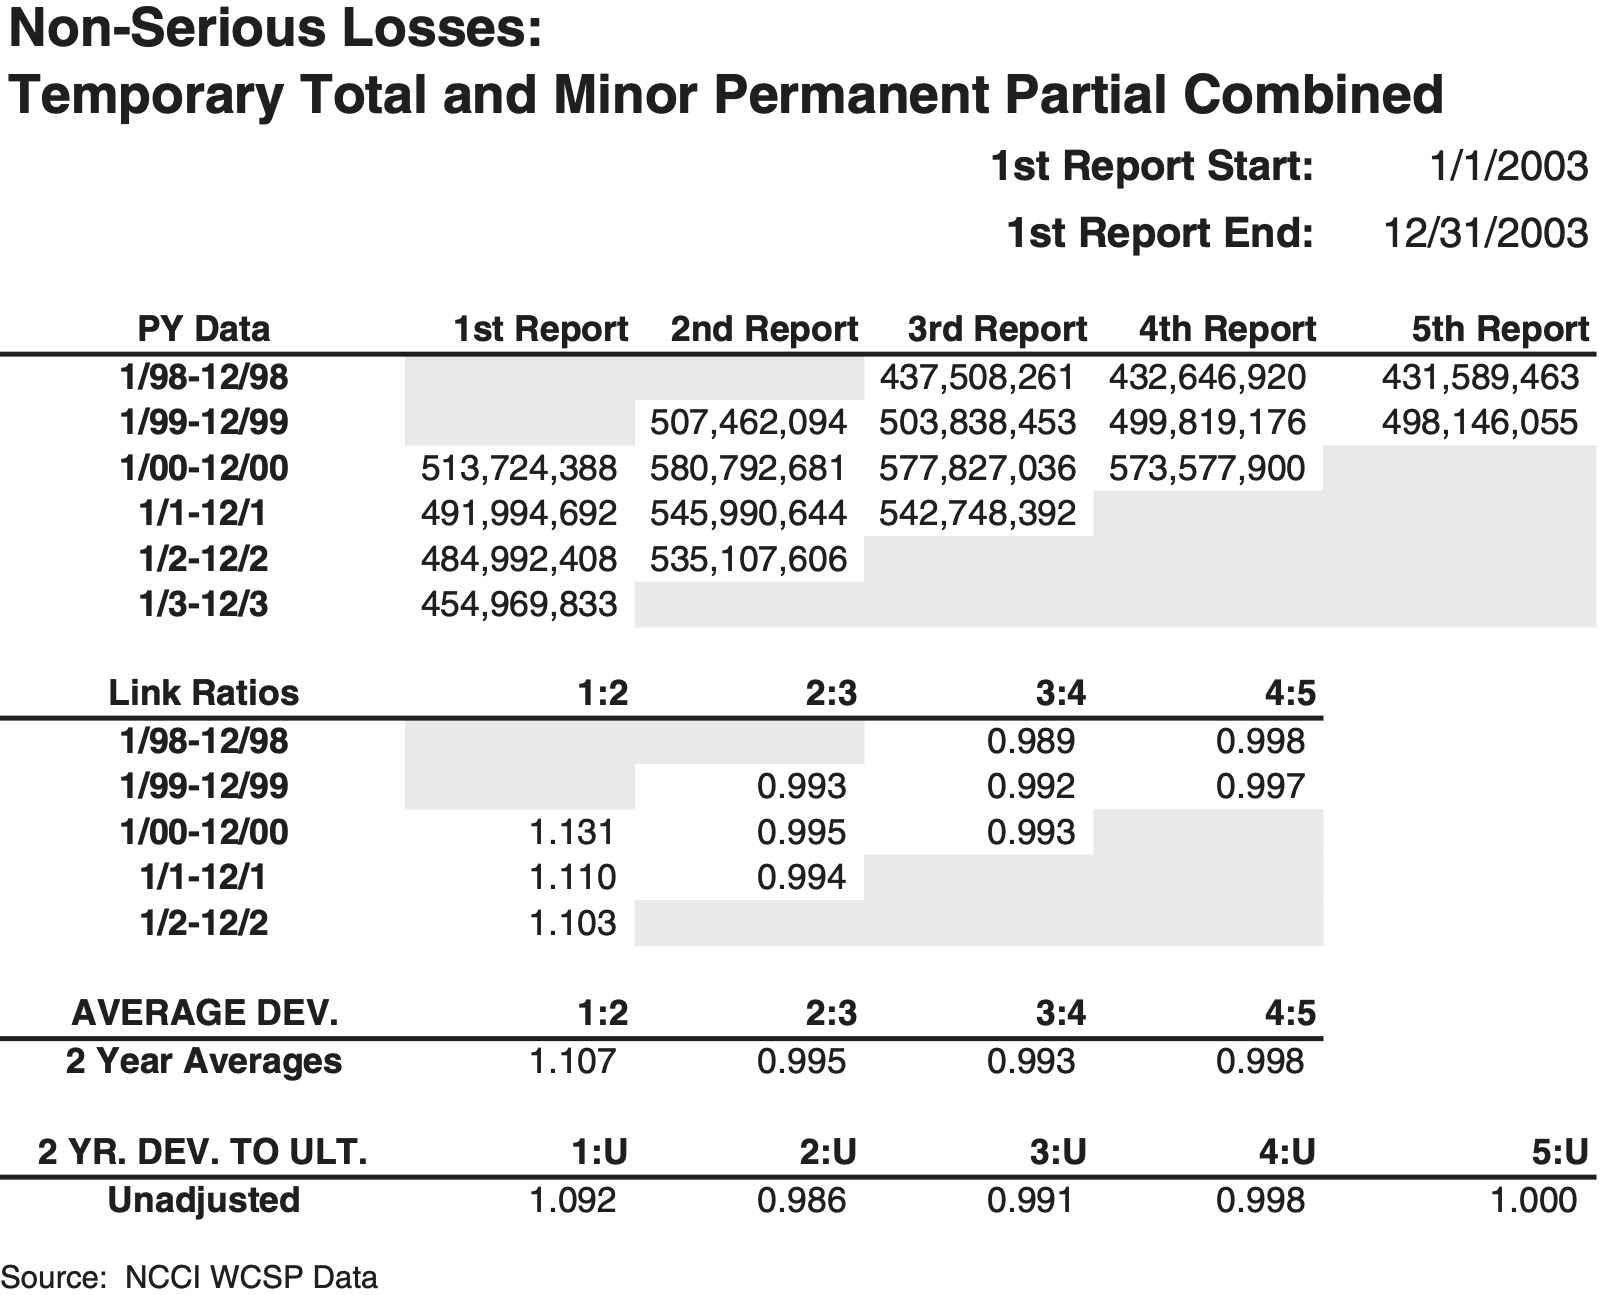
The critical value methodology was used in class ratemaking at NCCI beginning in 1966. Figure 3 demonstrates the distorting impact that critical value “crossover” inflicts on a dataset of permanent partial claims countrywide. Claims below the critical value are deemed minor while those that exceed it are deemed major. Various link ratios were computed for comparison from first to fourth report.

2.5. How we solved the crossover problem
A fresh approach was initiated by investigating a new field, the injured part of body, which NCCI began collecting on its URE starting with policies effective in 1996. NCCI’s actuaries researched to determine whether the injured body part provided any causal relationship in predicting whether or not a claim’s loss dollar amount developed upward at later reports. The initial approach proceeded as follows:
-
Extract a large volume of claims containing claim specific information such as injury type, report level, injured body part, open/closed claim indicator, and associated dollars of “paid + case” loss.
-
Assess the impact that critical value “crossover” (illustrated earlier) and injury type “crossover” may have upon LDFs. (A common example of injury type “crossover” is a temporary total claim eventually becoming a permanent partial claim at a later age.)
-
Determine if claim severity is an indicator of the propensity of a claim to develop.
-
Analyze the injured body part to determine if it is a predictor of a claim’s propensity to develop (or not develop).
-
Group the body part and injury type combinations into those more likely-to-develop (L) and those not-likely-to-develop (N) so that the groupings are more predictive than the serious and non-serious groupings.
True loss development can best be measured if claims are not allowed to migrate across different development groups. Figure 3, which illustrated the distortion to link ratios that “crossover” causes provided valuable insight supporting this. Because claims were moving across the critical value and also across the injury types, a solution was needed to assess whether or not the injured body part was a determining characteristic of loss development. The solution was to “lock down” the entire dataset of claims being studied at each link ratio. Thus, the exact same claims were observed at adjacent reports, such as first to second, and the loss development measured accordingly. Note, the set of claims used to observe the loss development from second to third report could be a different set of claims than those observed at first to second report.
This “lock down” approach helped NCCI determine which injured body parts developed more or less than others.
2.5.1. How was the injured body part approach determined?
Two new loss development triangles were created. The first was a grouping of claims whose injured body parts, and associated loss dollars, were likely to develop upwards significantly over time. The second grouping would consist of claims whose injured body parts, and associated loss dollars, were not likely to develop over time. The creation of body part groupings made sense, as there were 55 body part codes, and generating a credible volume of losses at a state level for each injured part of body was a concern. Within a state, loss development between the two groups was compared relative to one another, as the losses in some states develop significantly more than others. For example, a back claim filed within a state having significant attorney involvement and longer benefit durations would be expected to develop more than a similar back claim in a state with little attorney involvement and shorter durations. (Some states have time limits for collecting benefits (i.e., duration), such as 425 weeks for permanent partial claims)
Determining which of the 55 body part codes would be mapped into the likely-to-develop and not-likely-to-develop was the next step.
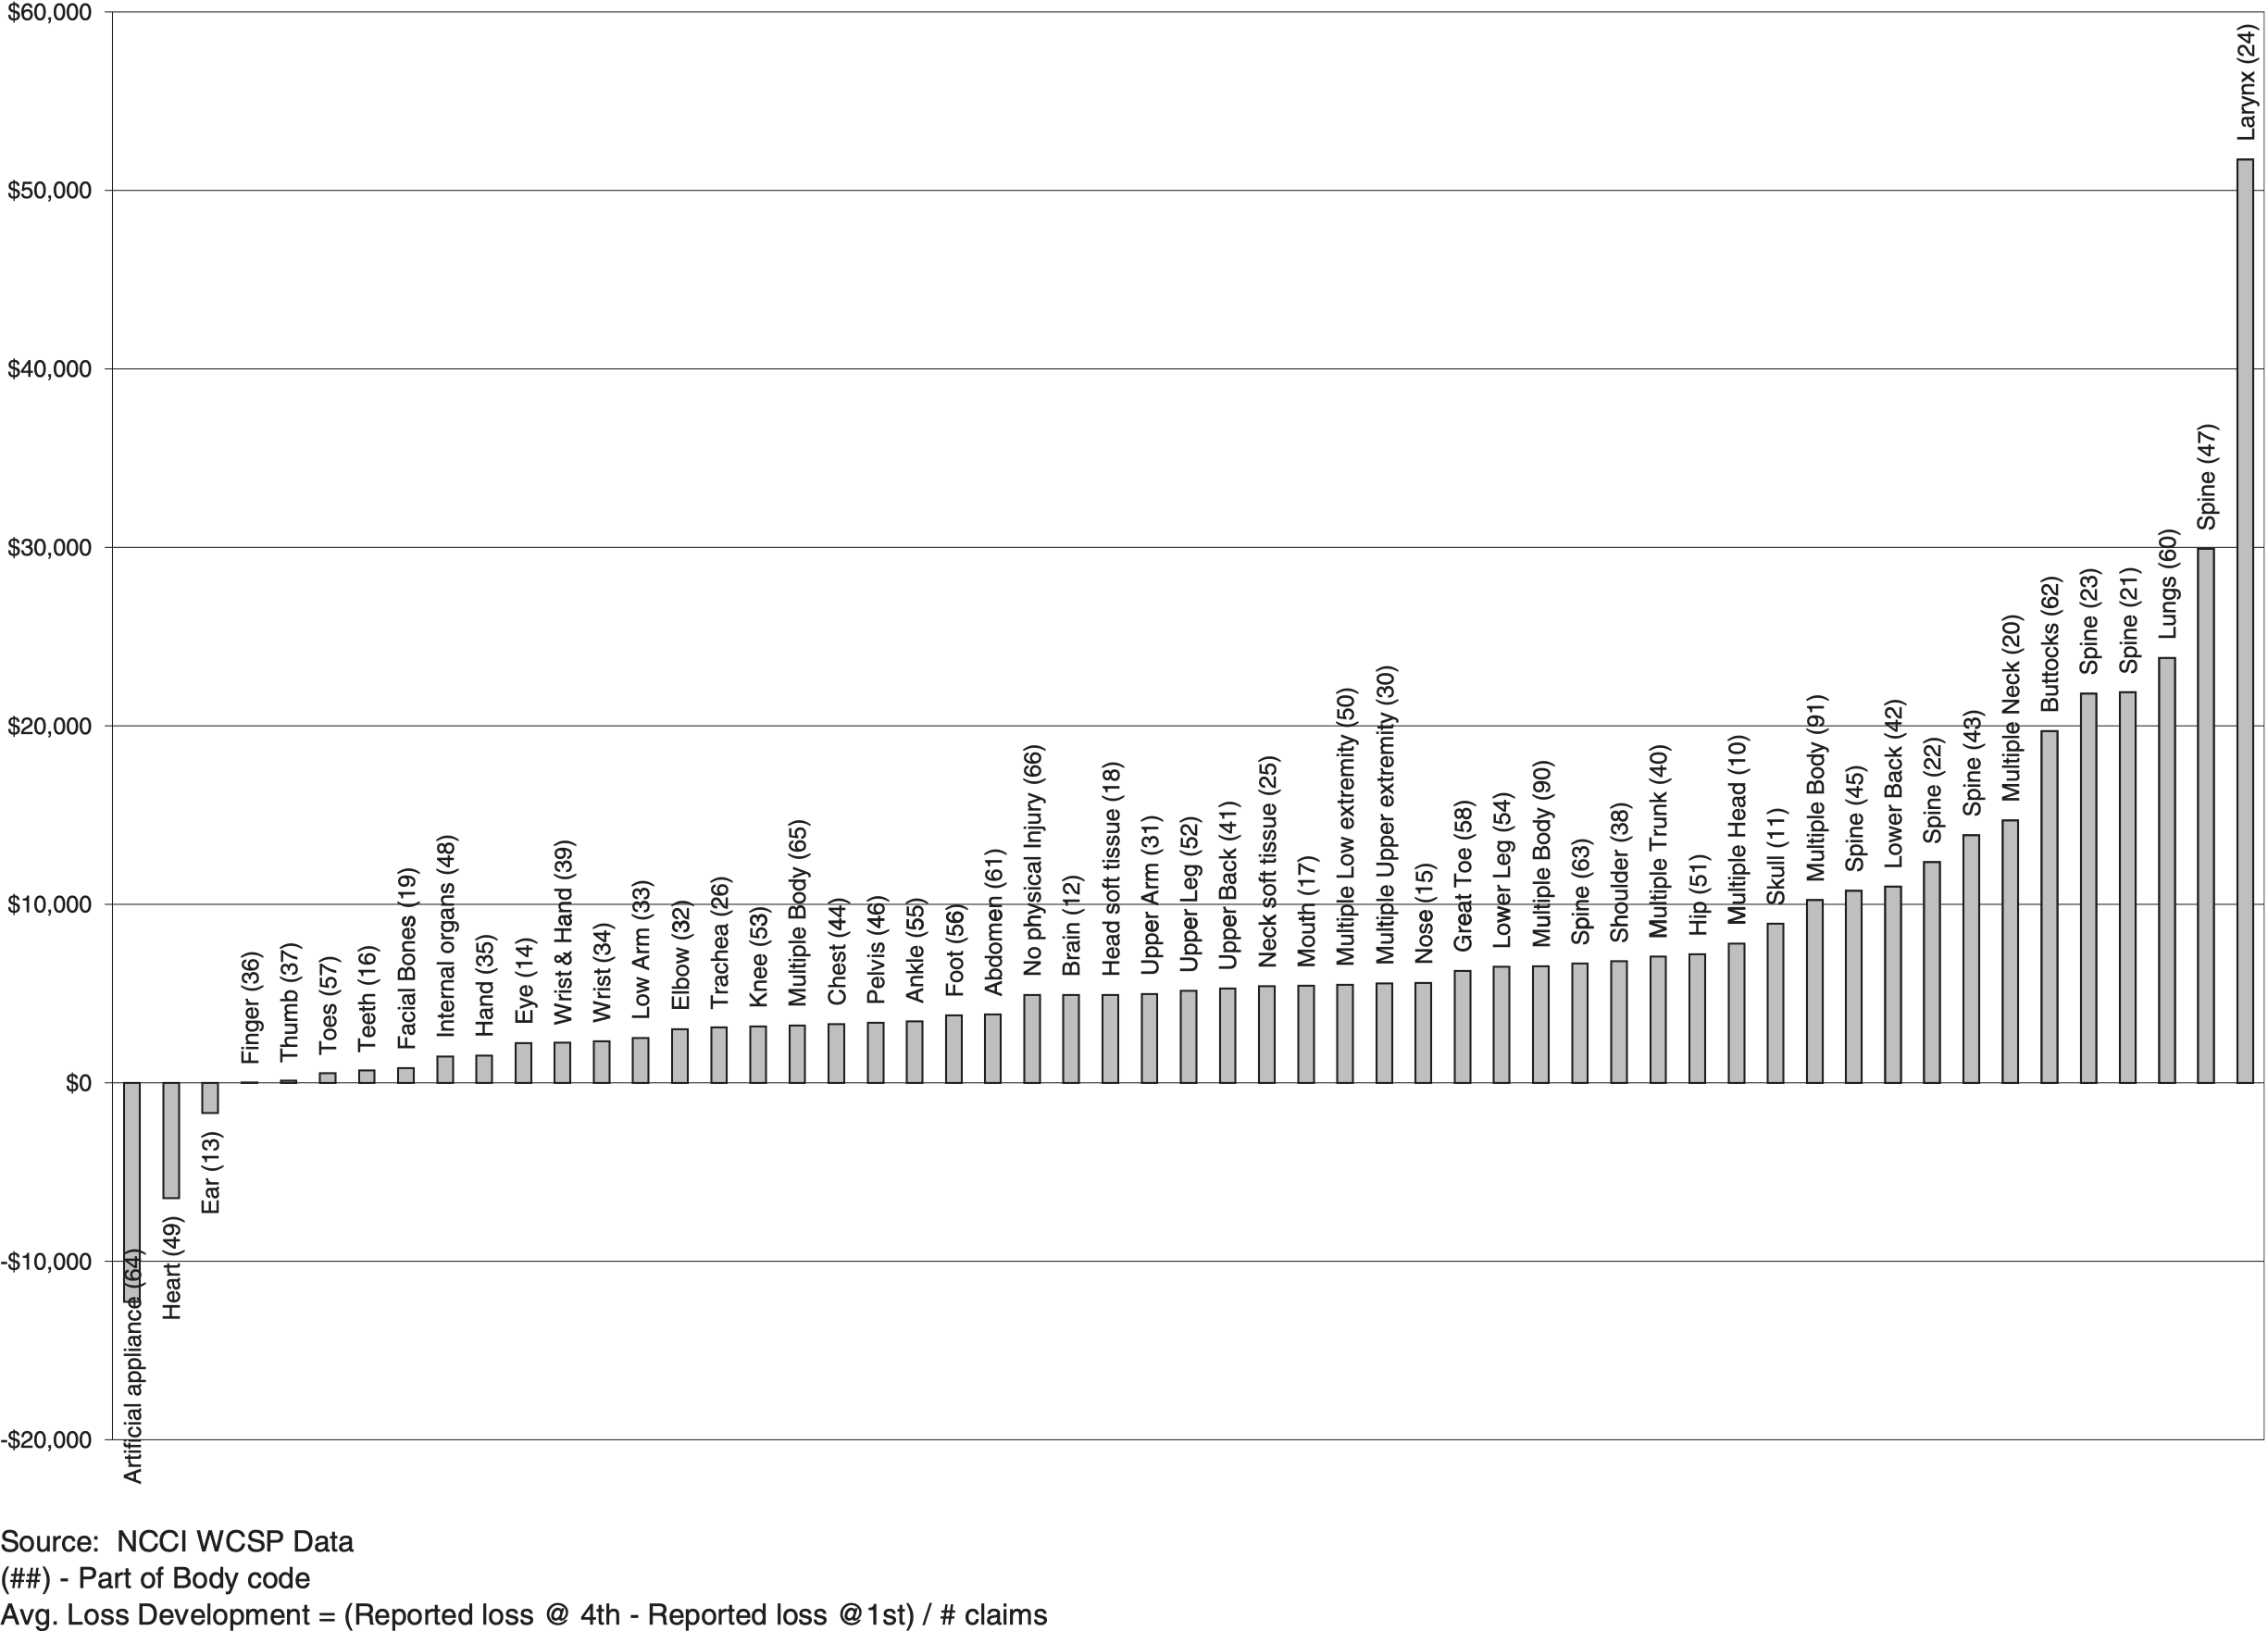
Two different analyses were completed for body part grouping. The result of the first analysis is shown in Figure 4. It measured loss development dollars by the “lock down” approach from first through fourth report (initially, fifth report was unavailable). The metric quantifying the observed average loss development per claim was
(Reported Losses @ 4th - Reported Losses @ 1st) Number of claims

This approach provided insight into which body parts developed more than others.
In Figure 4, the body part codes contributing to the largest amount of upward loss development per case were the back, head, neck, multiple body, and internal organs. The downside of using this metric as the only measure for making decisions is that much loss development in workers compensation happens beyond fifth report. NCCI later began collecting sixth reports of open claims for policy year 1999 and beyond, eventually collecting up to tenth report.
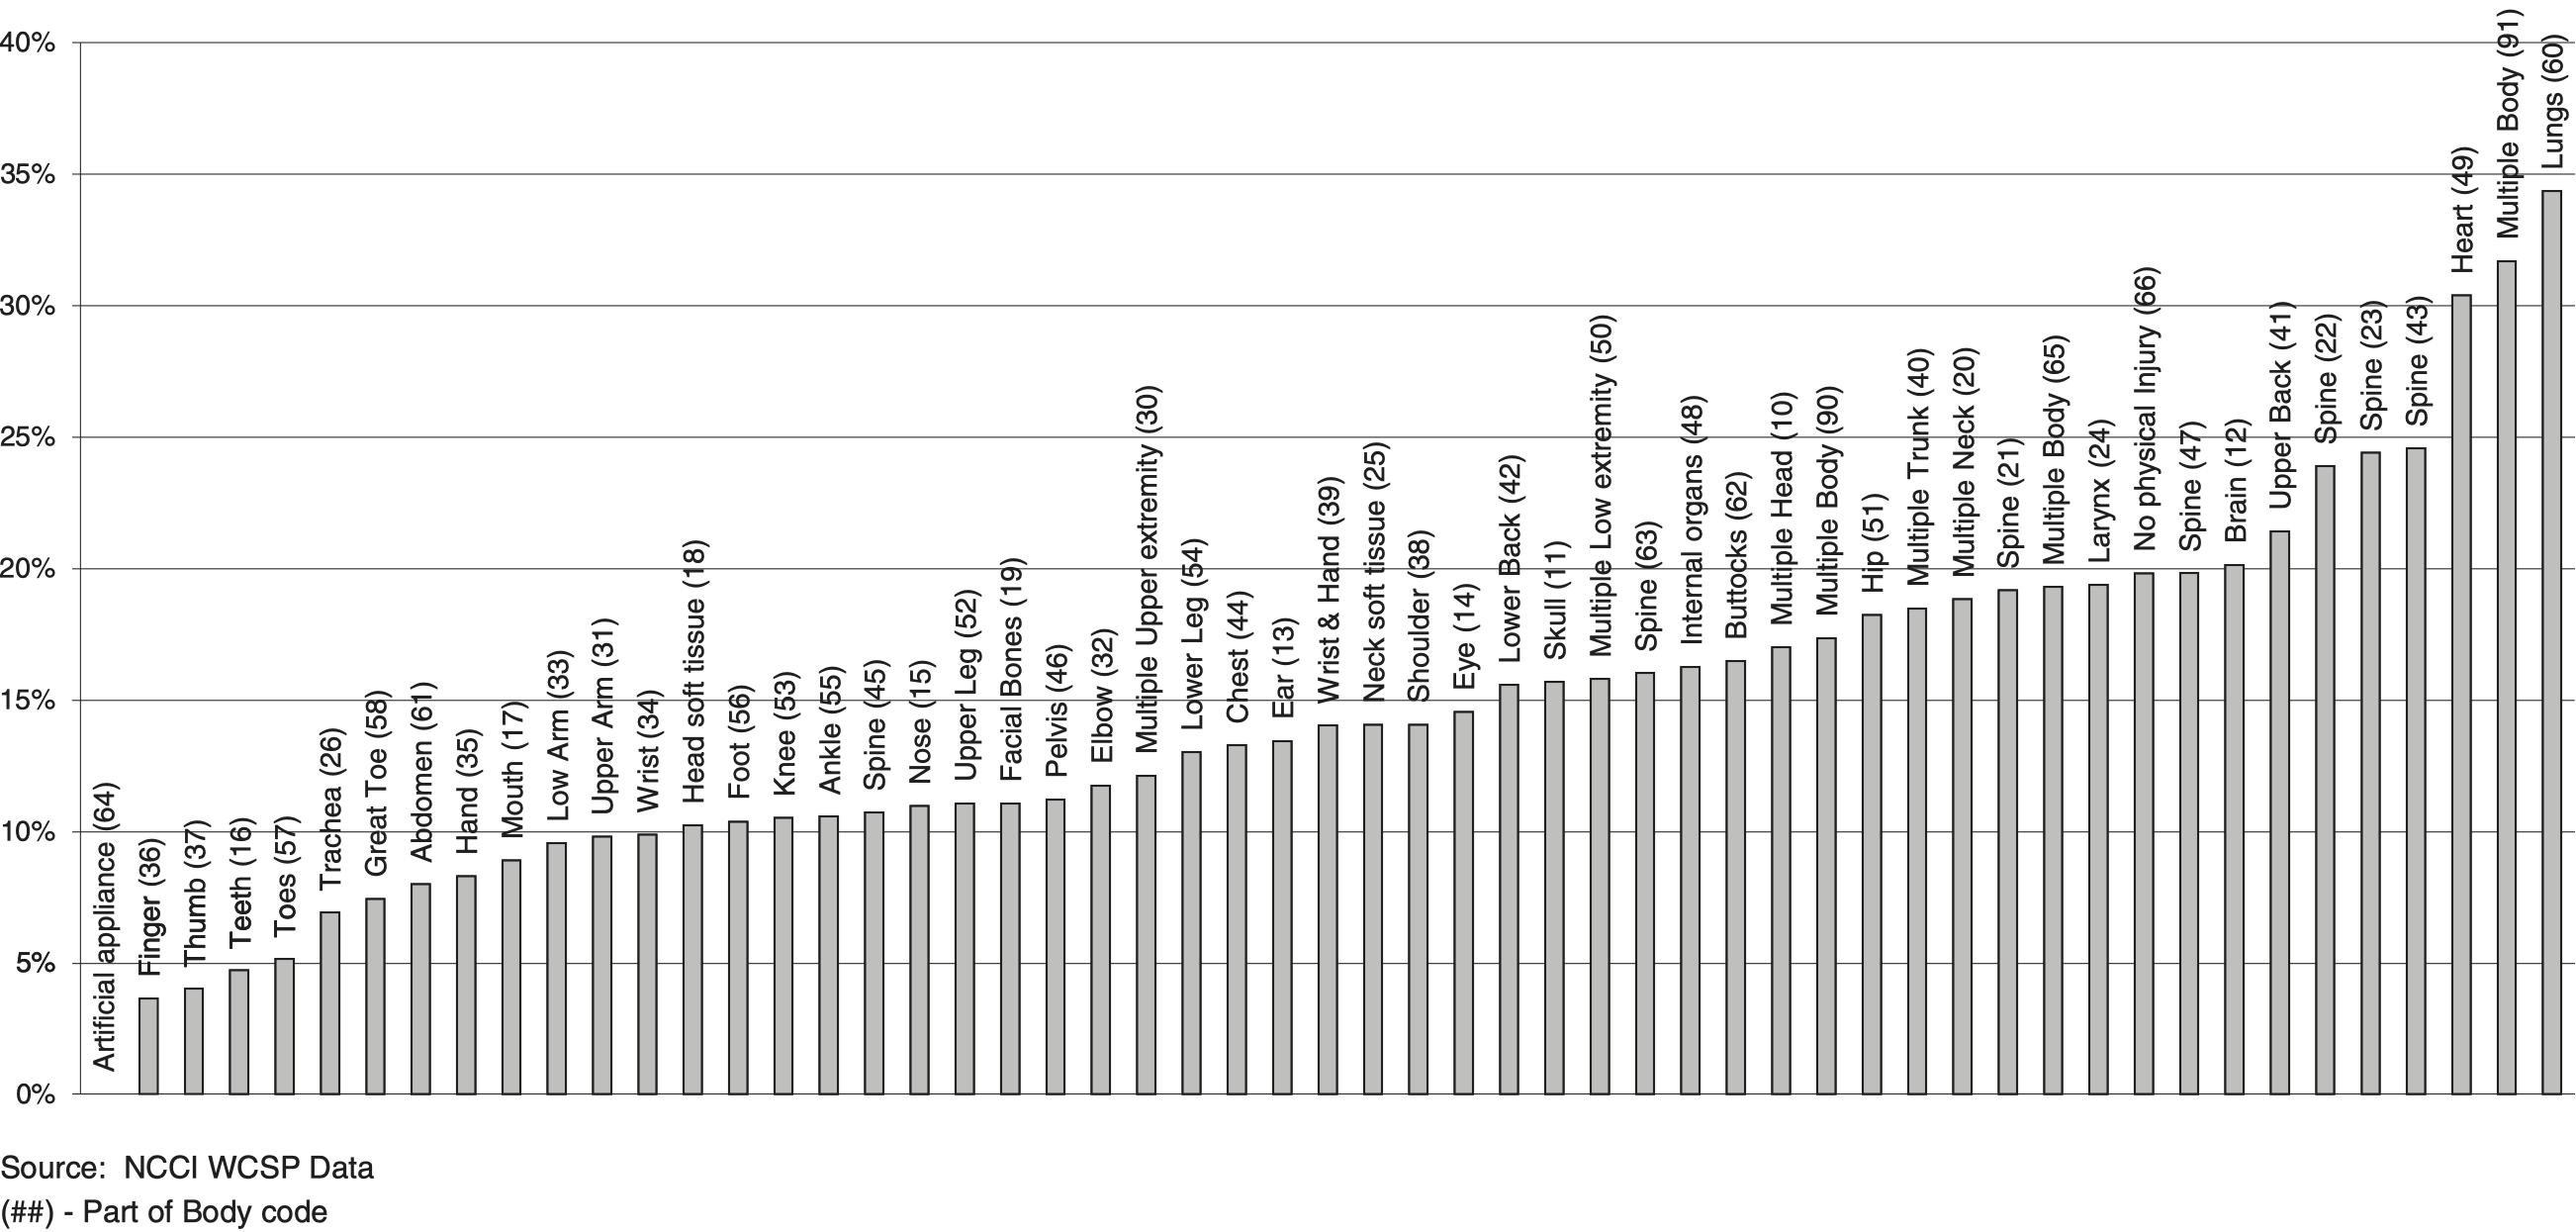
Therefore, a second measure was applied to group the body parts into likely-to-develop and not-likely-to-develop categories. The second metric determined what percentage of claims remained open at fifth report, sorted by part of body. Figure 5 shows an illustration for permanent partial claims.

Staff calculated the same two metrics for temporary total claims, which yielded similar results as permanent partial claims.
Actuarial judgment also played a role in the final decisions to determine into which groupings the various body parts were ultimately placed. Consideration was given to the fact that certain parts of body are considered scheduled injuries in many states having scheduled permanent partial injuries. Body parts like toes, fingers, hands, feet, arms, and legs are often mandated a predetermined dollar amount in statutory benefit schedules. Therefore, they are not likely to develop upward. A listing of all body part codes and the grouping to which they were mapped is provided in the Appendix.
2.5.2. How was the injury type considered?
Once the body parts were mapped to the likely-to-develop (L) and not-likely-to-develop (N) groupings, a few different tests were performed. The first characteristic considered was the claim’s injury type.
Two injury types initially examined in depth were temporary total (TT) and permanent partial (PP), where the majority of claims and loss dollars reside. The first test was whether or not claim severity was a good indicator of the likelihood of a claim developing and the second test was to observe if the groupings of body parts produced link ratios that were larger for the L grouping than the N grouping. The second test would substantiate the mapping of body parts to the L and N groupings.
Figure 6 provides three key observations:
-
Claim severity is not predictive of higher loss development (claims below $26,000 produced much higher LDFs for TT than those which began at a value greater than $26,000), suggesting the critical value approach is conceptually flawed.
-
The medical pattern behaves differently than indemnity, in that the LDF from first to fifth is about the same whether above or below the $26,000, and
-
The L group develops more than the N group for both PP and TT, as evidenced by the higher link ratios.

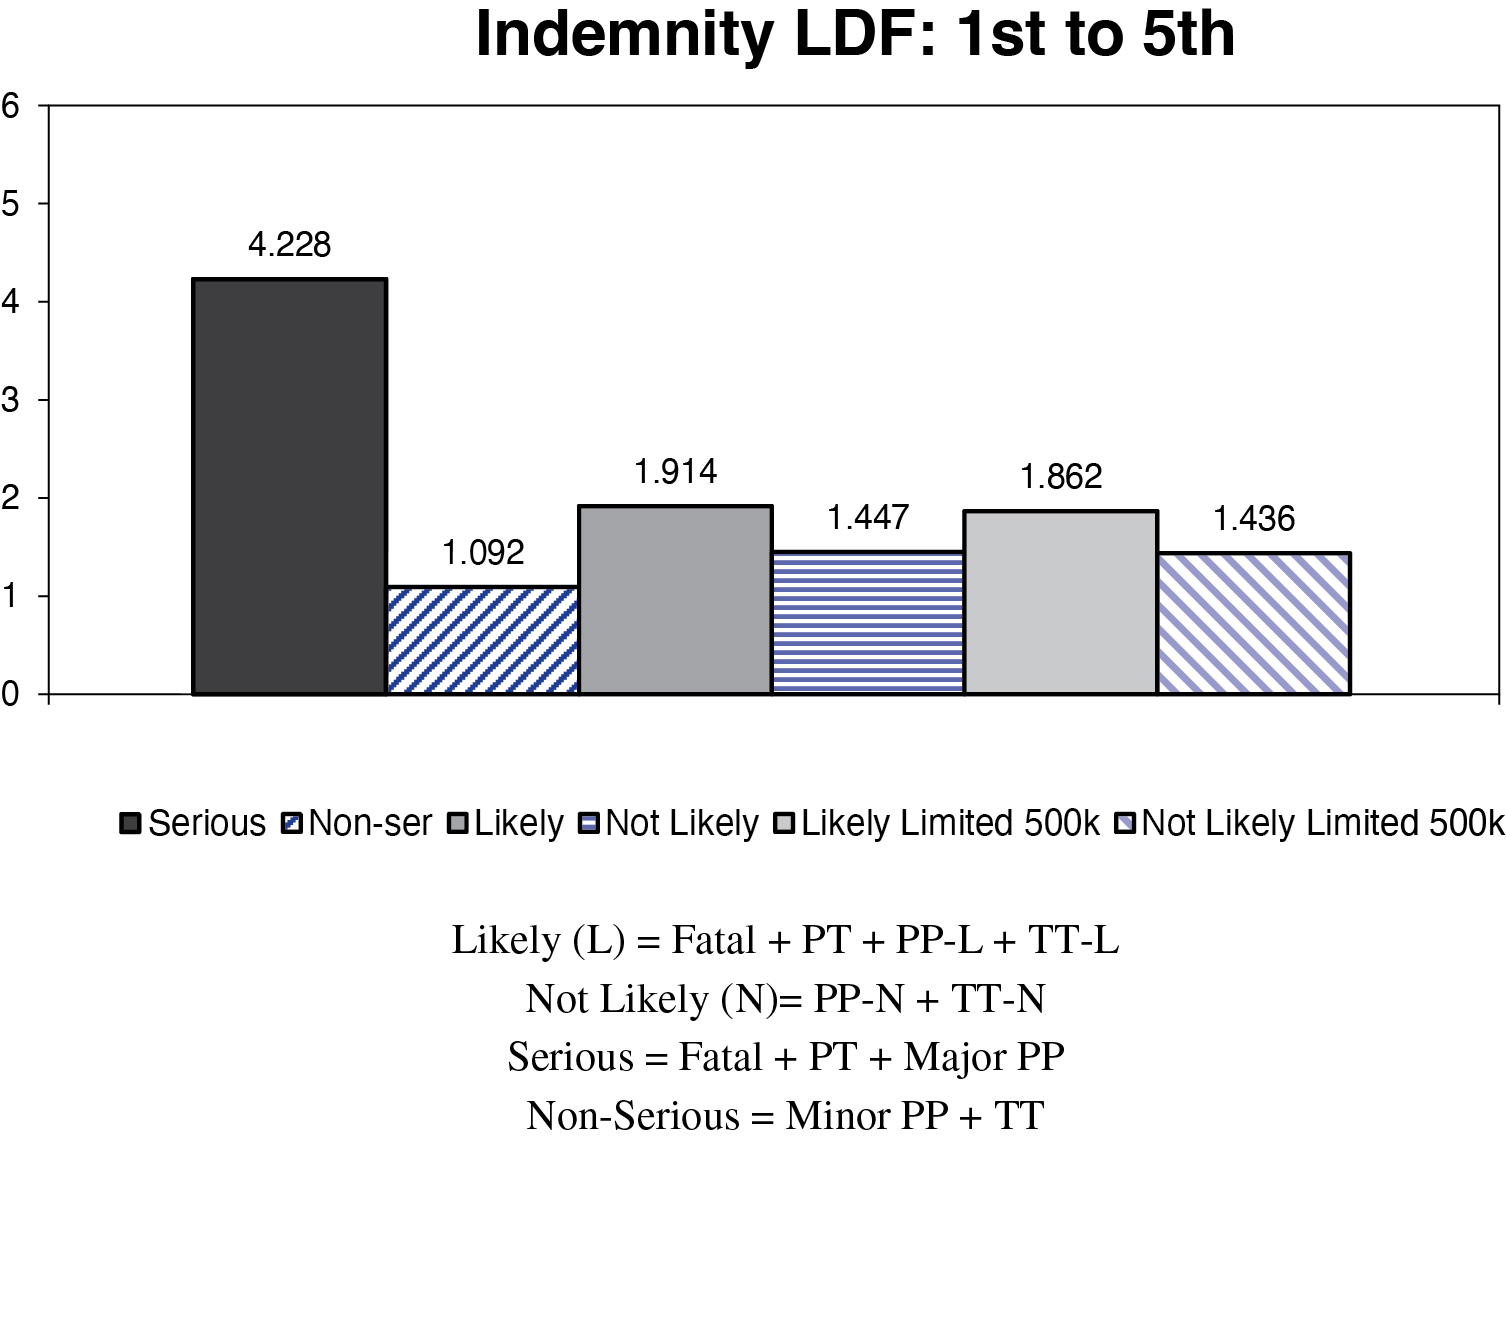
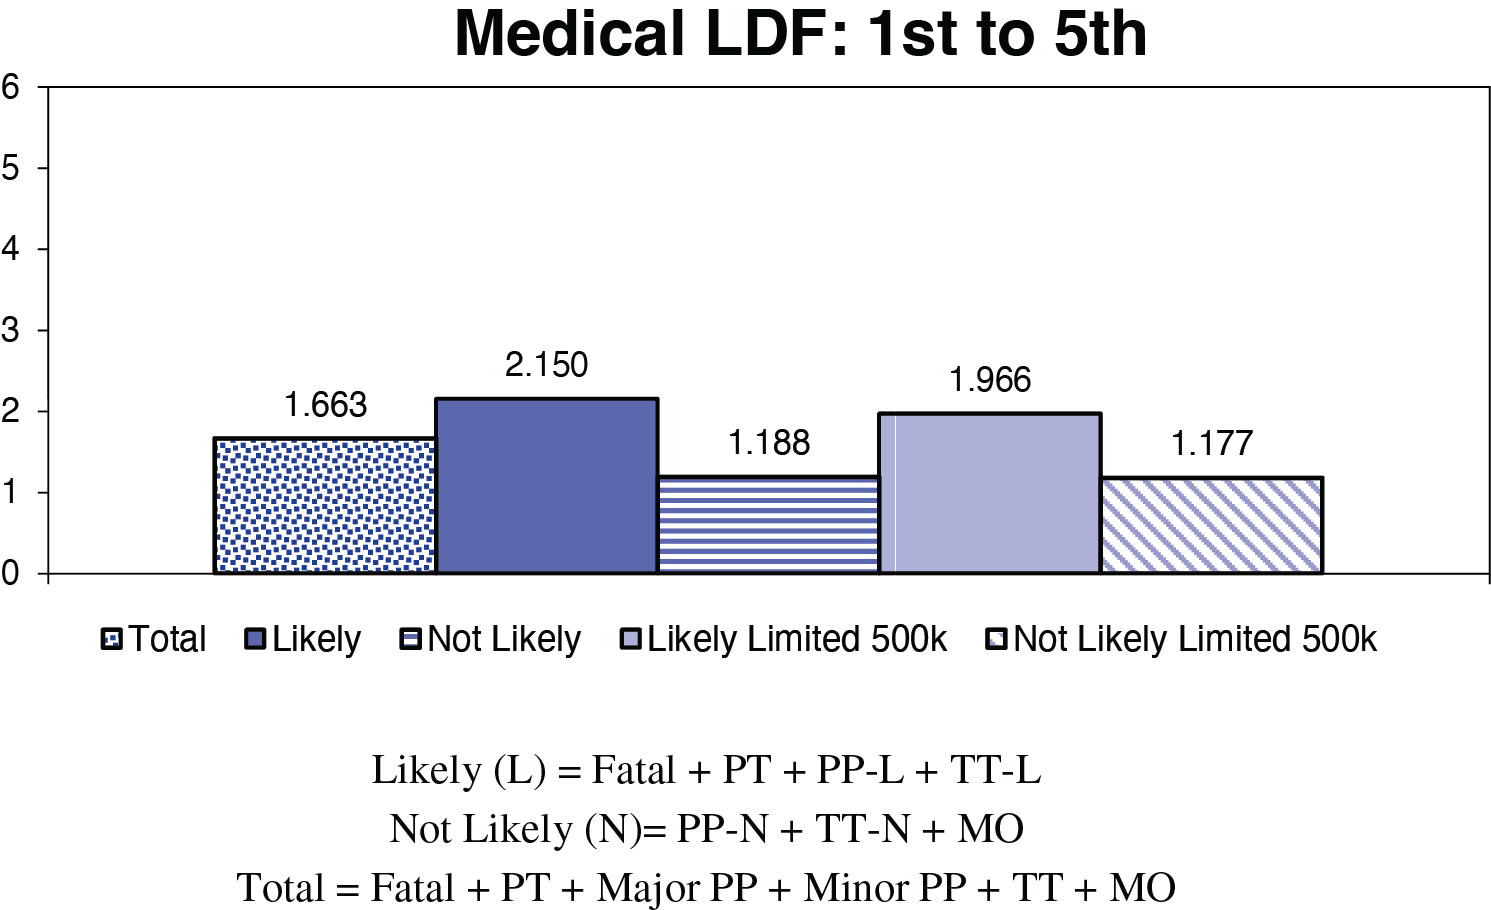
Next, the new groupings and their loss development patterns were compared by state to the prior serious and non-serious LDFs. Figures 7a (indemnity) and 7b (medical) provide LDF comparisons for two states, identified only as NCCI state (based on the same dollars as Figure 1a) and Another NCCI state.


Figures 7a and 7b show LDFs on an unlimited basis and on a limited (@ $500K) basis. Unlimited factors were used in the prior methodology. The new class ratemaking enhancements include limiting individual claims at $500K. Thus, a portion of the difference in the magnitude of LDF from prior to new methodology is due to a loss limitation being applied within the new methodology.
Figures 7a and 7b illustrate LDF patterns using the following groupings of claims based upon injured part of body and injury type combinations:
Likely ( L )= Fatal + PT + PP-L + TT-L .
Not Likely (N)= PP-N + TT-N + MO.
Serious = Fatal + PT + Major PP.
Non-serious = Minor PP + TT + MO.
Because many fatal and permanent total claims are open at fifth report, each is originally placed into the L grouping. Medical-only claims are assigned to the N grouping because most open and close out quickly, unlikely to develop upward.
The injury types providing the biggest challenges are the permanent partial and temporary total claims because:
-
Many temporary total claims evolve into permanent partial claims at the end of the healing period, when injured workers reach maximum medical improvement.
-
Both critical value crossover and injury type crossover are common for temporary total and permanent partial claims.
-
These two injury types comprise between 70% and 80% of all loss dollars incurred.
The team of NCCI actuaries started investigating injury type loss development patterns by state, exploring if other URE data elements could be used to further refine the L and N groupings.
2.5.3. The search for the optimal loss development groupings
Some of the data elements explored were claims including ALAE, the nature of injury, and the cause of injury. None of these provided any clear solutions.
However, there was one data element that was clearly correlated with the propensity of a claim to develop (or not), the open/closed claim status indicator. The majority of loss development observed was coming from claims which were open at first report, which is logical. Closed claims are not likely to develop (however, a few claims do close and reopen in workers compensation).
A new countrywide (i.e., all NCCI states) data extract was created. Dollars of loss were compiled for each policy year and state as follows:
-
By injury type at each report level, for policy years 1999–2002 (1999 had 6 annual reports available at the time).
-
By the claim status open (O) or closed (C) at first report and each subsequent report level.
-
By the injured part of body assignment to category L or N.
-
Large claims were limited at $500,000.
-
Indemnity and medical losses were aggregated separately, but combined across all states.
-
Only states and years in URE format.
Claims having an injured body part mapped to the L grouping are referred to as “likely” body parts. Similarly, claims having an injured body part mapped to the N grouping are referred to as “not-likely” body parts.[1] All claims are “locked down” at every report level to examine true loss development, not allowing any to move across subcategories. This variation of the “lock down” is different than that used earlier in the initial research of injured part of body, where the set of claims is fixed only at adjacent reports for determining each link ratio.
Once “locked down” at the initial report, no claims are allowed to enter or leave the group throughout the entire observed development time frame (i.e., first through sixth report). The loss dollars for each injury type are segregated into four new subcategories and LDFs are computed:
-
LO—“likely” body part and claim open at first report.
-
LC—“likely” body part and claim closed at first report.
-
NO—“not-likely” body part and claim open at first report.
-
NC—“not-likely” body part and claim closed at first report.
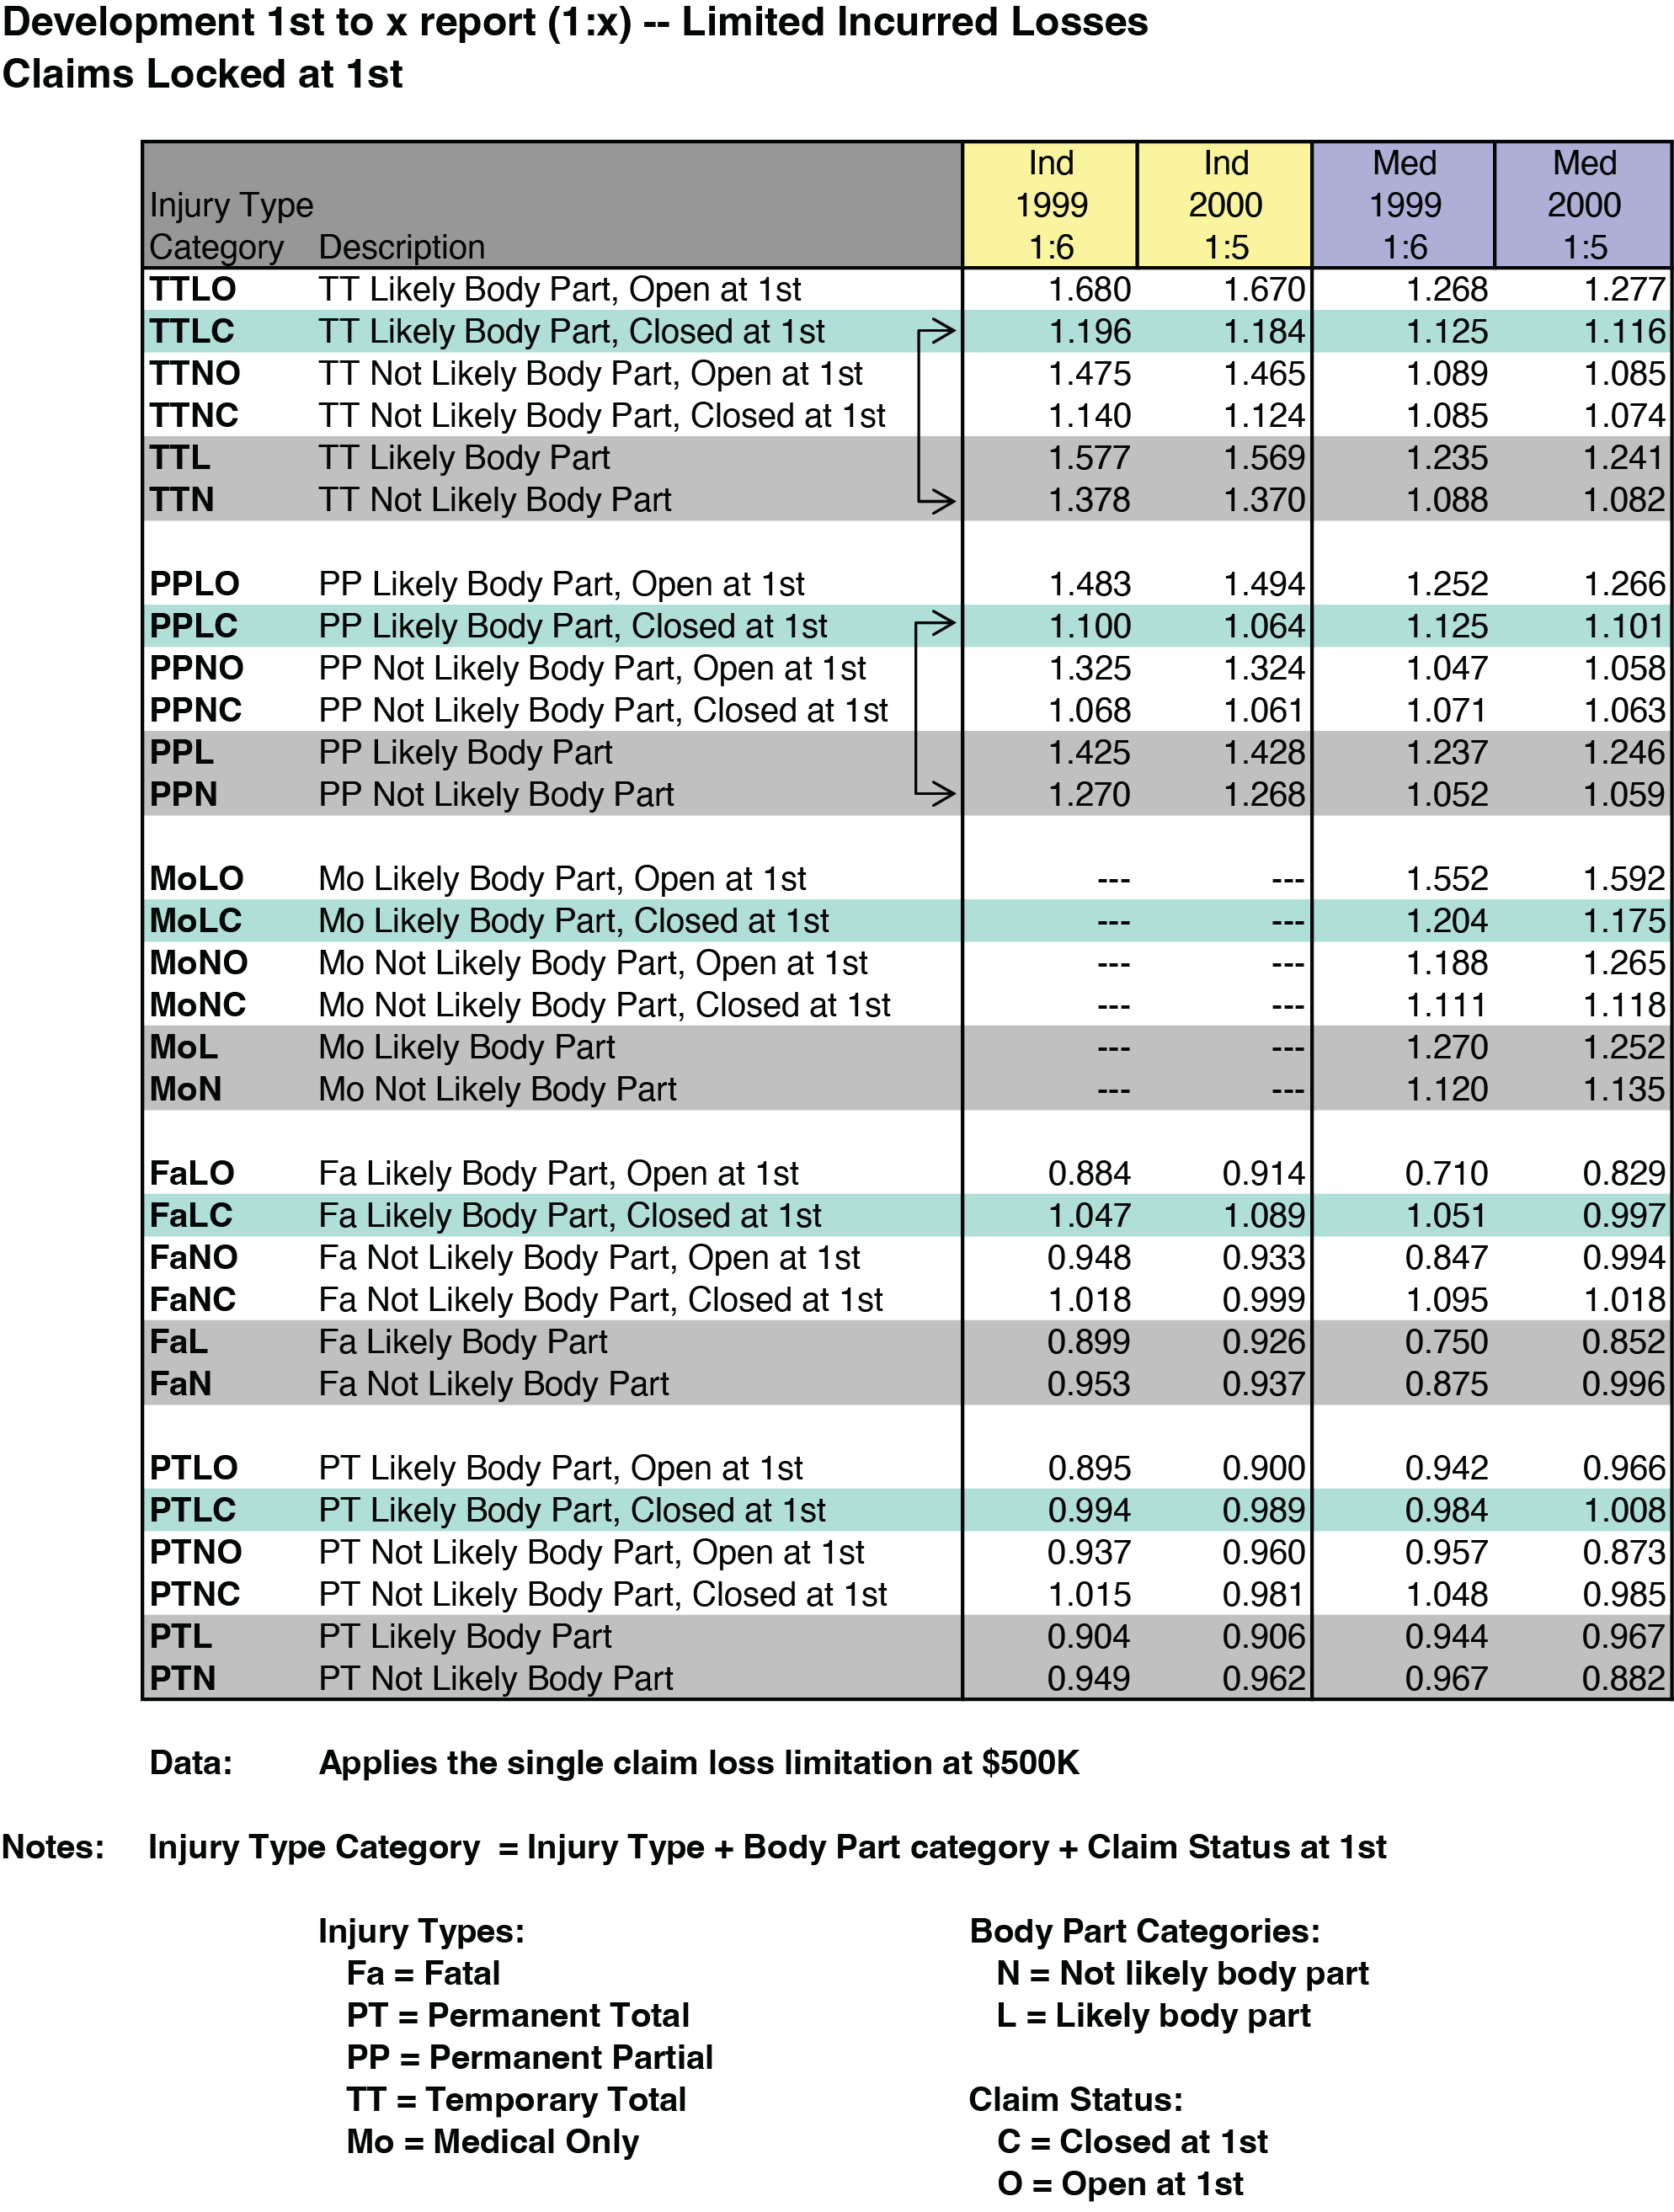
Three important observations for permanent partial (PP) and temporary total (TT) claims follow from Figure 8a:
-
Losses from claims in the L body part categories consistently develop upward more than its N counterpart, confirming that the body part assignments are sound.
-
Claims open (O) at first report develop much more than the closed (C) claims do. Thus, the combination of L and O at first report better differentiates the LDF.
-
Focus on the arrows on Figure 8a for TTLC and PPLC. Claims assigned to L for a particular body part, but which were closed (C) at first report, align more closely with the TT-N and PP-N LDF grouping. Thus, by moving claims having the combination of L and C at first report into the N grouping further refines the LDF patterns.

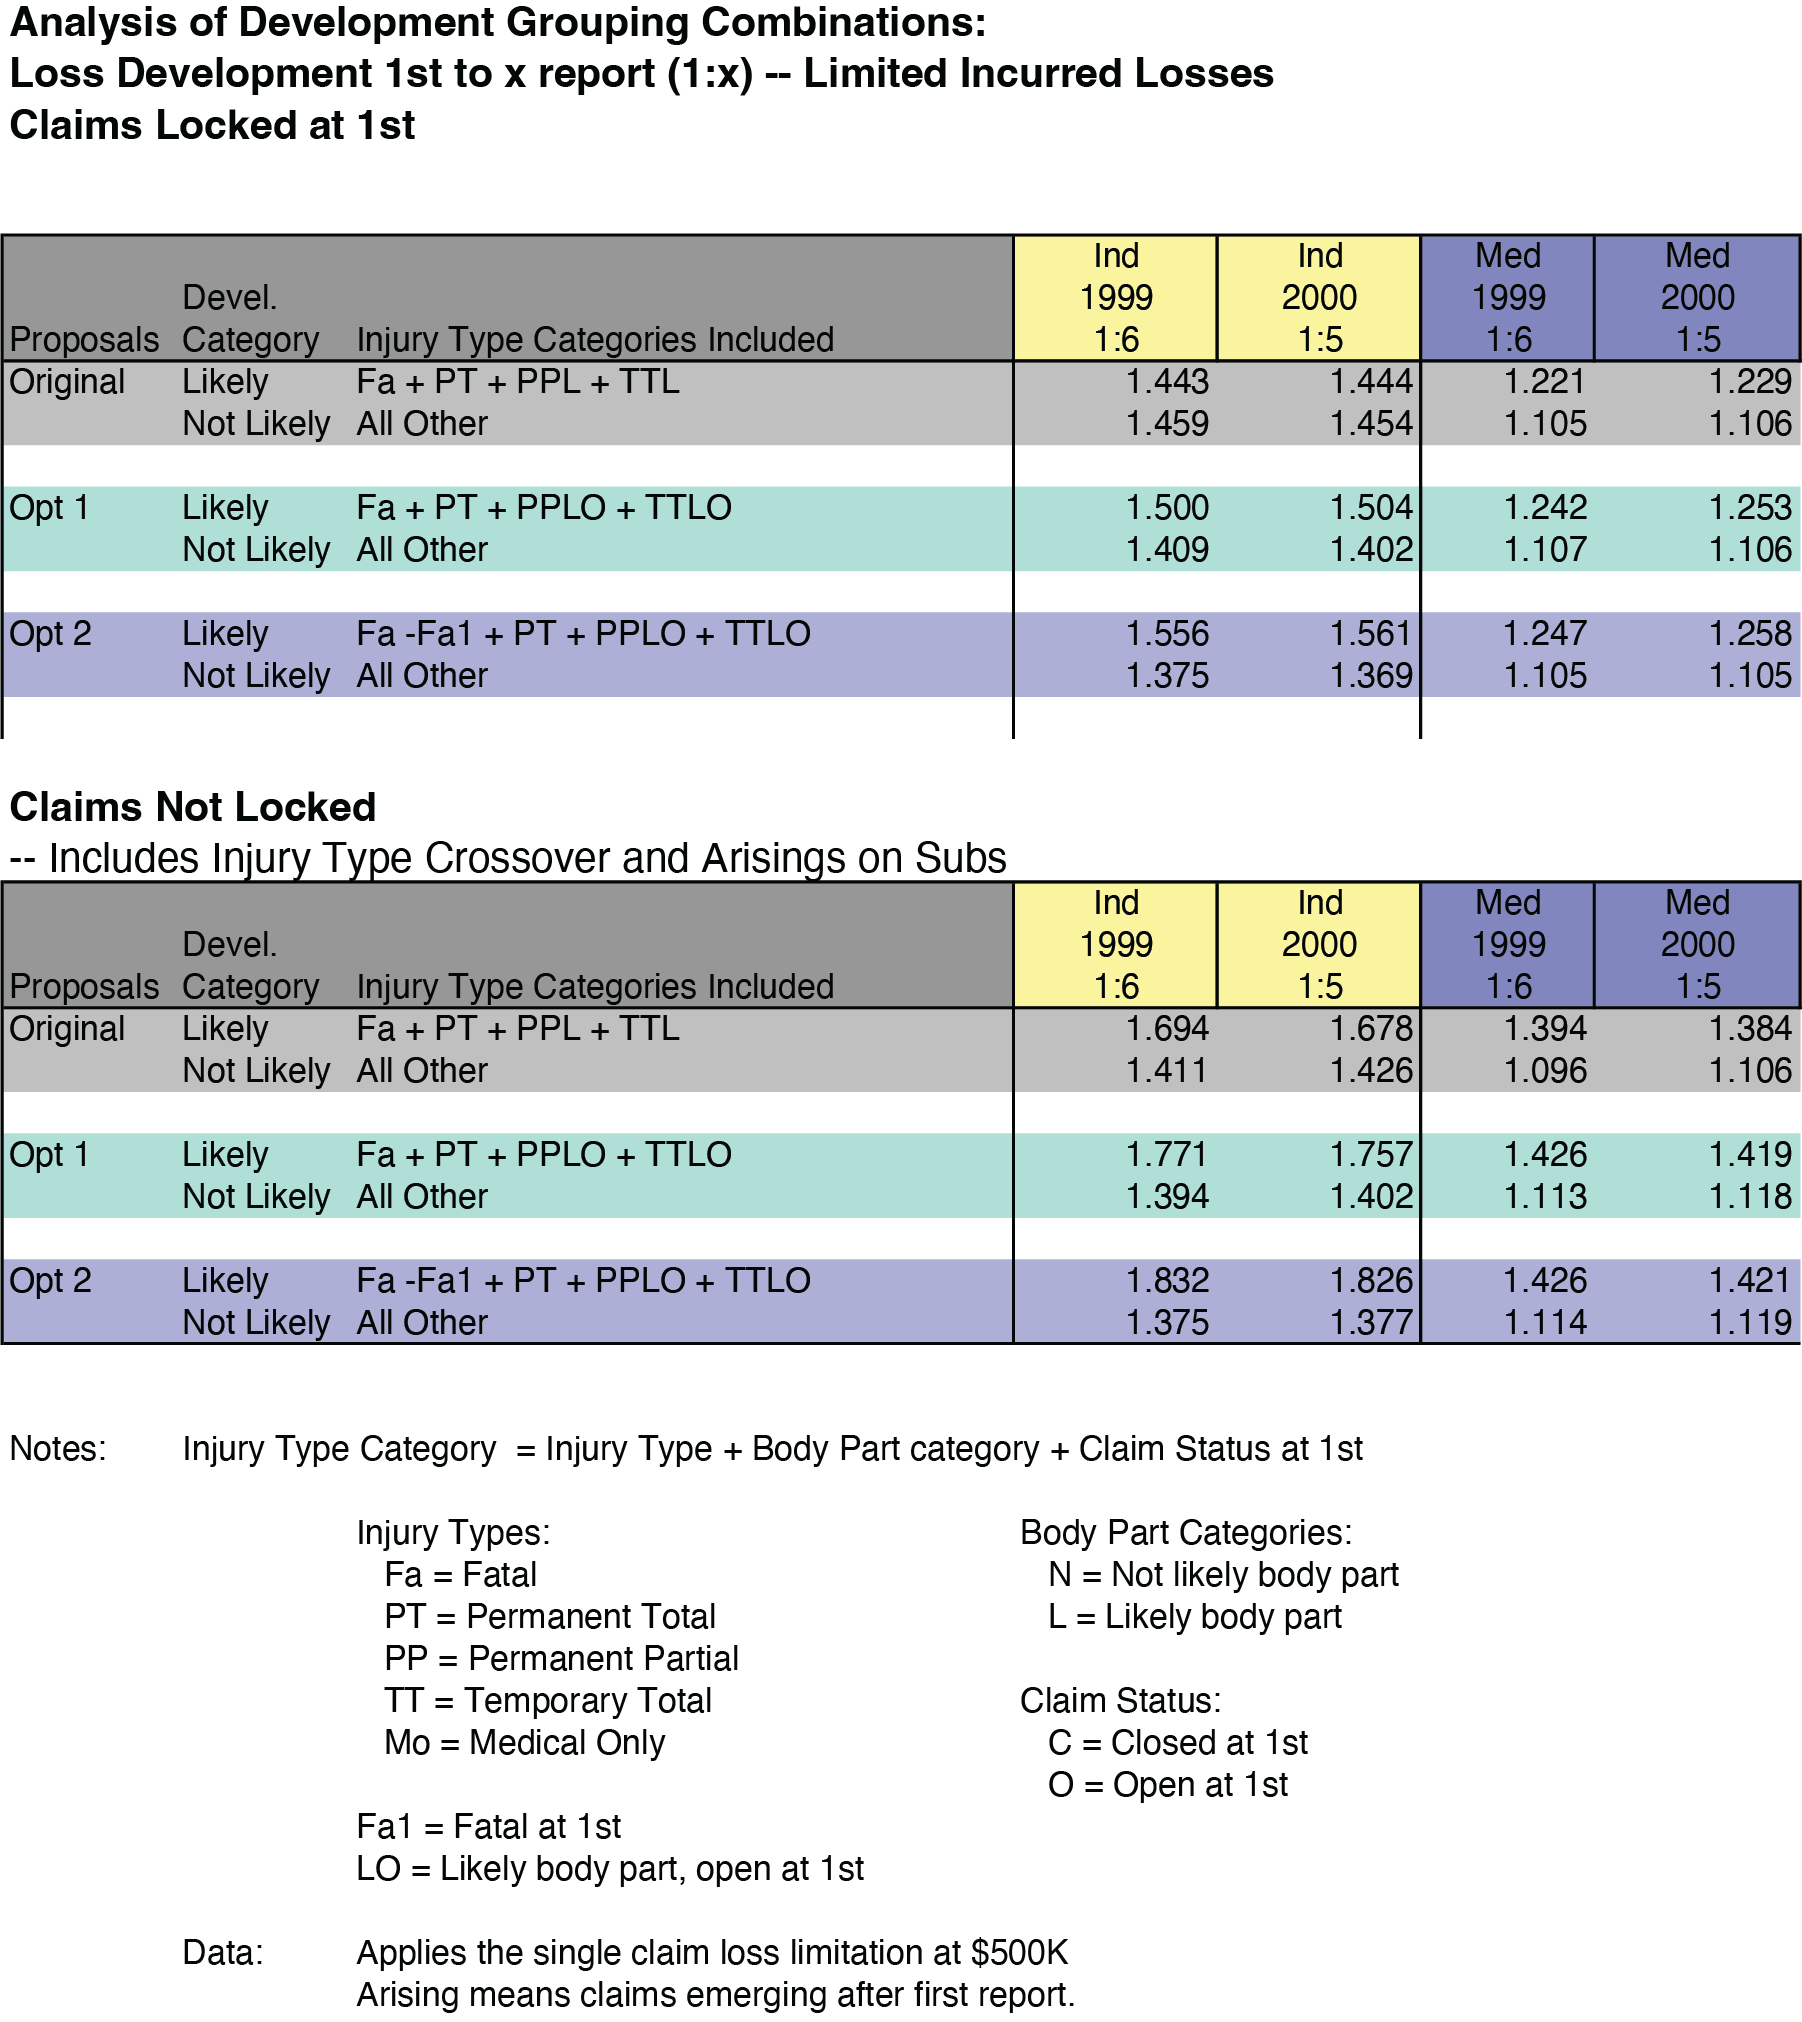
NCCI constructed various alternatives based upon the observations from Figure 8a. The combinations of injury type/part of body grouping (L or N)/claim status (O and C) were organized into new options in Figure 8b to compare with the “original” research proposal (refer to Equations 2.1 and 2.2).

2.5.4. How are the fatal and permanent total injury types treated?
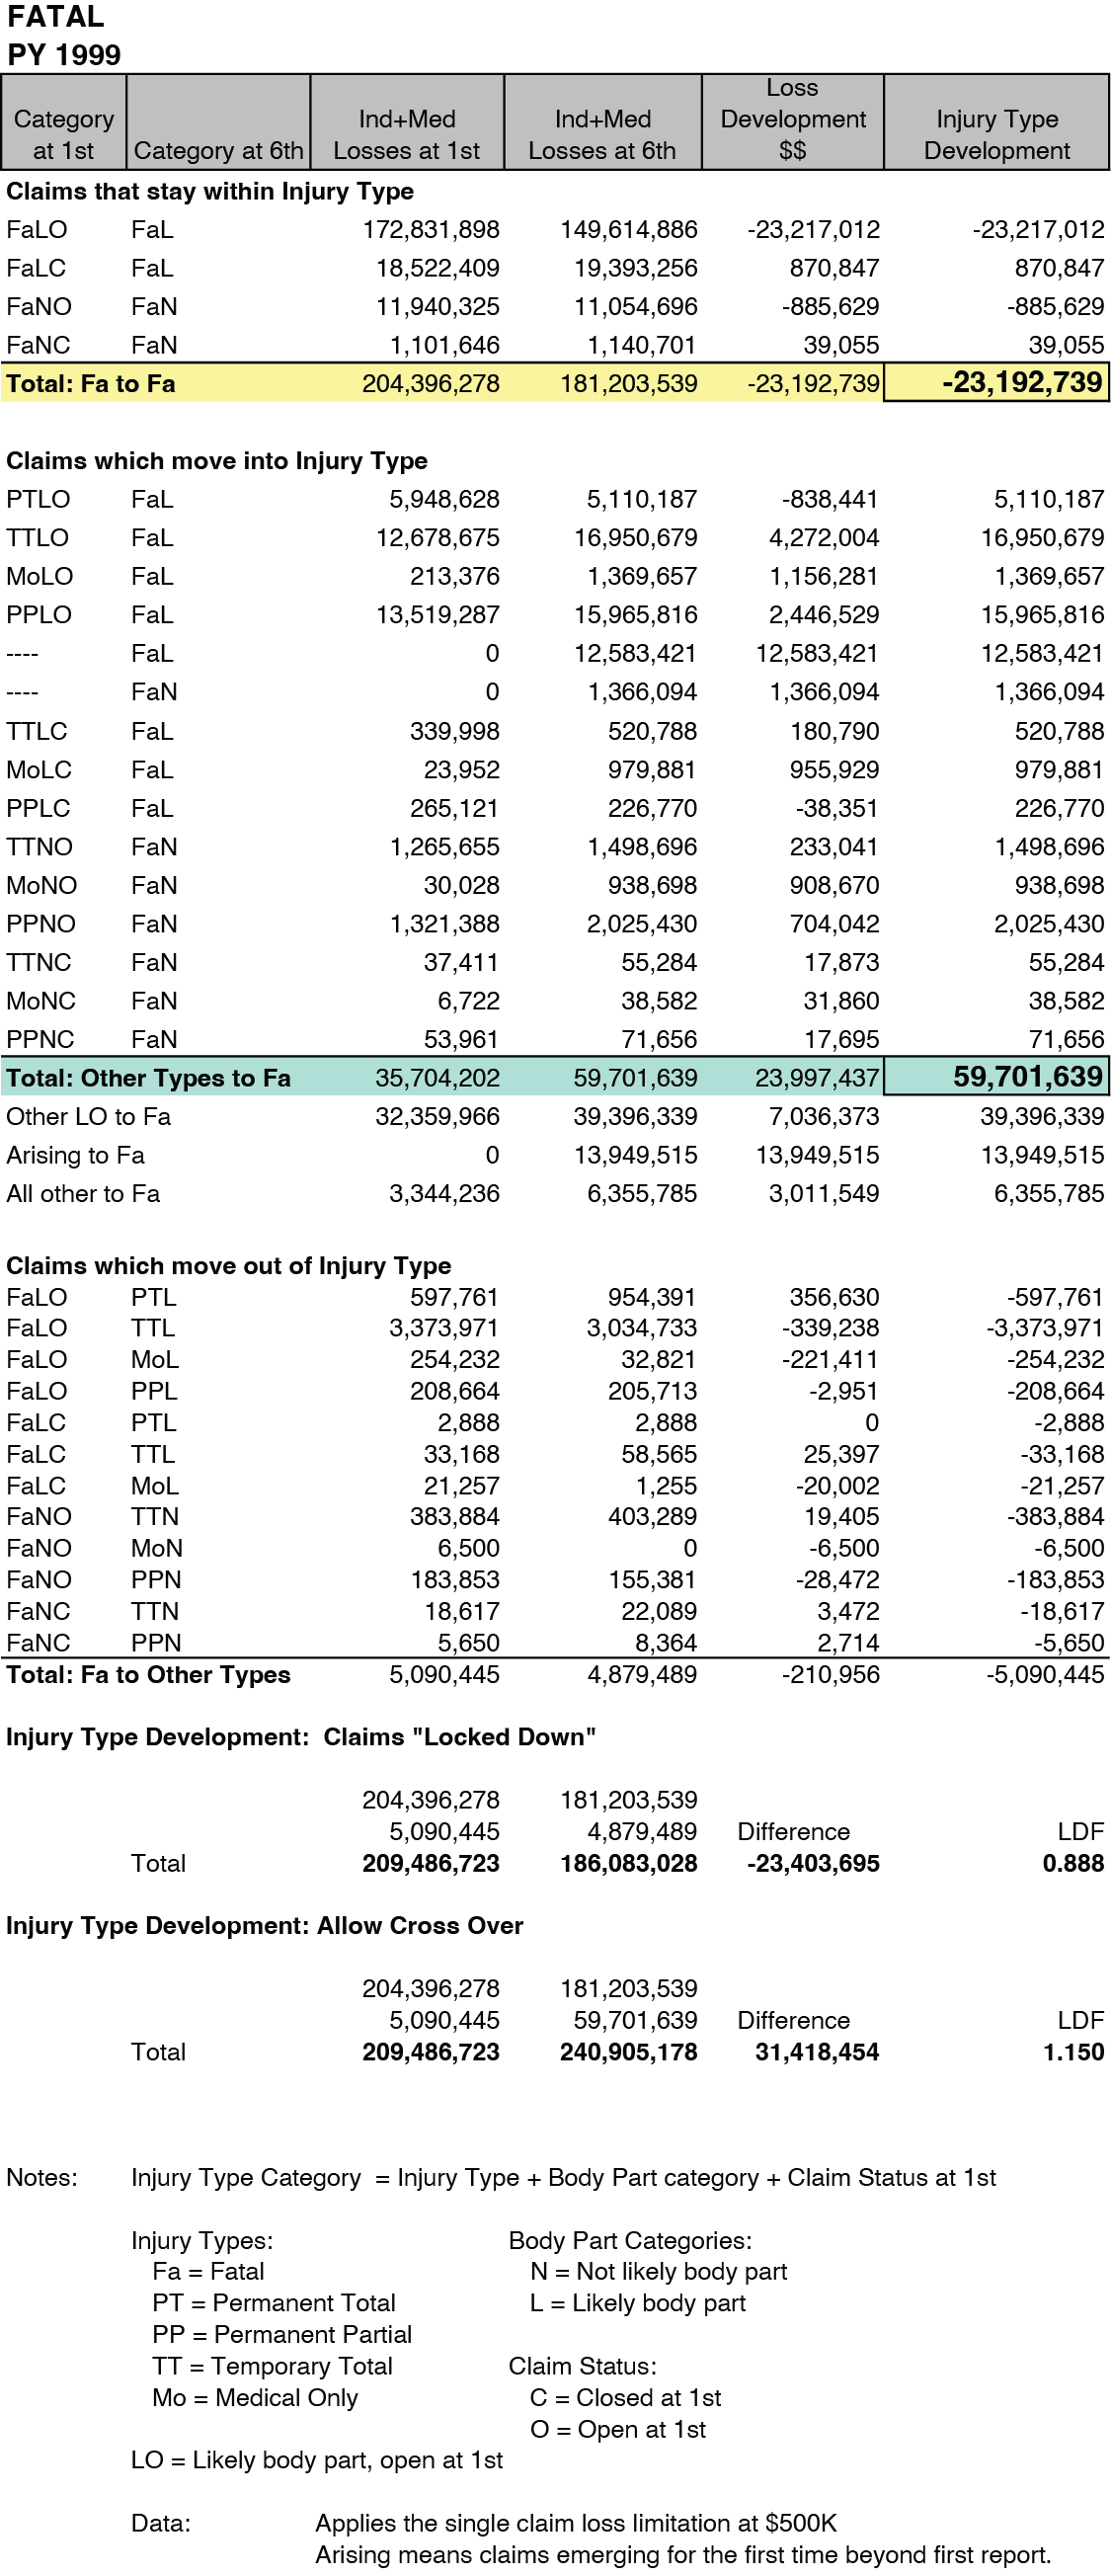
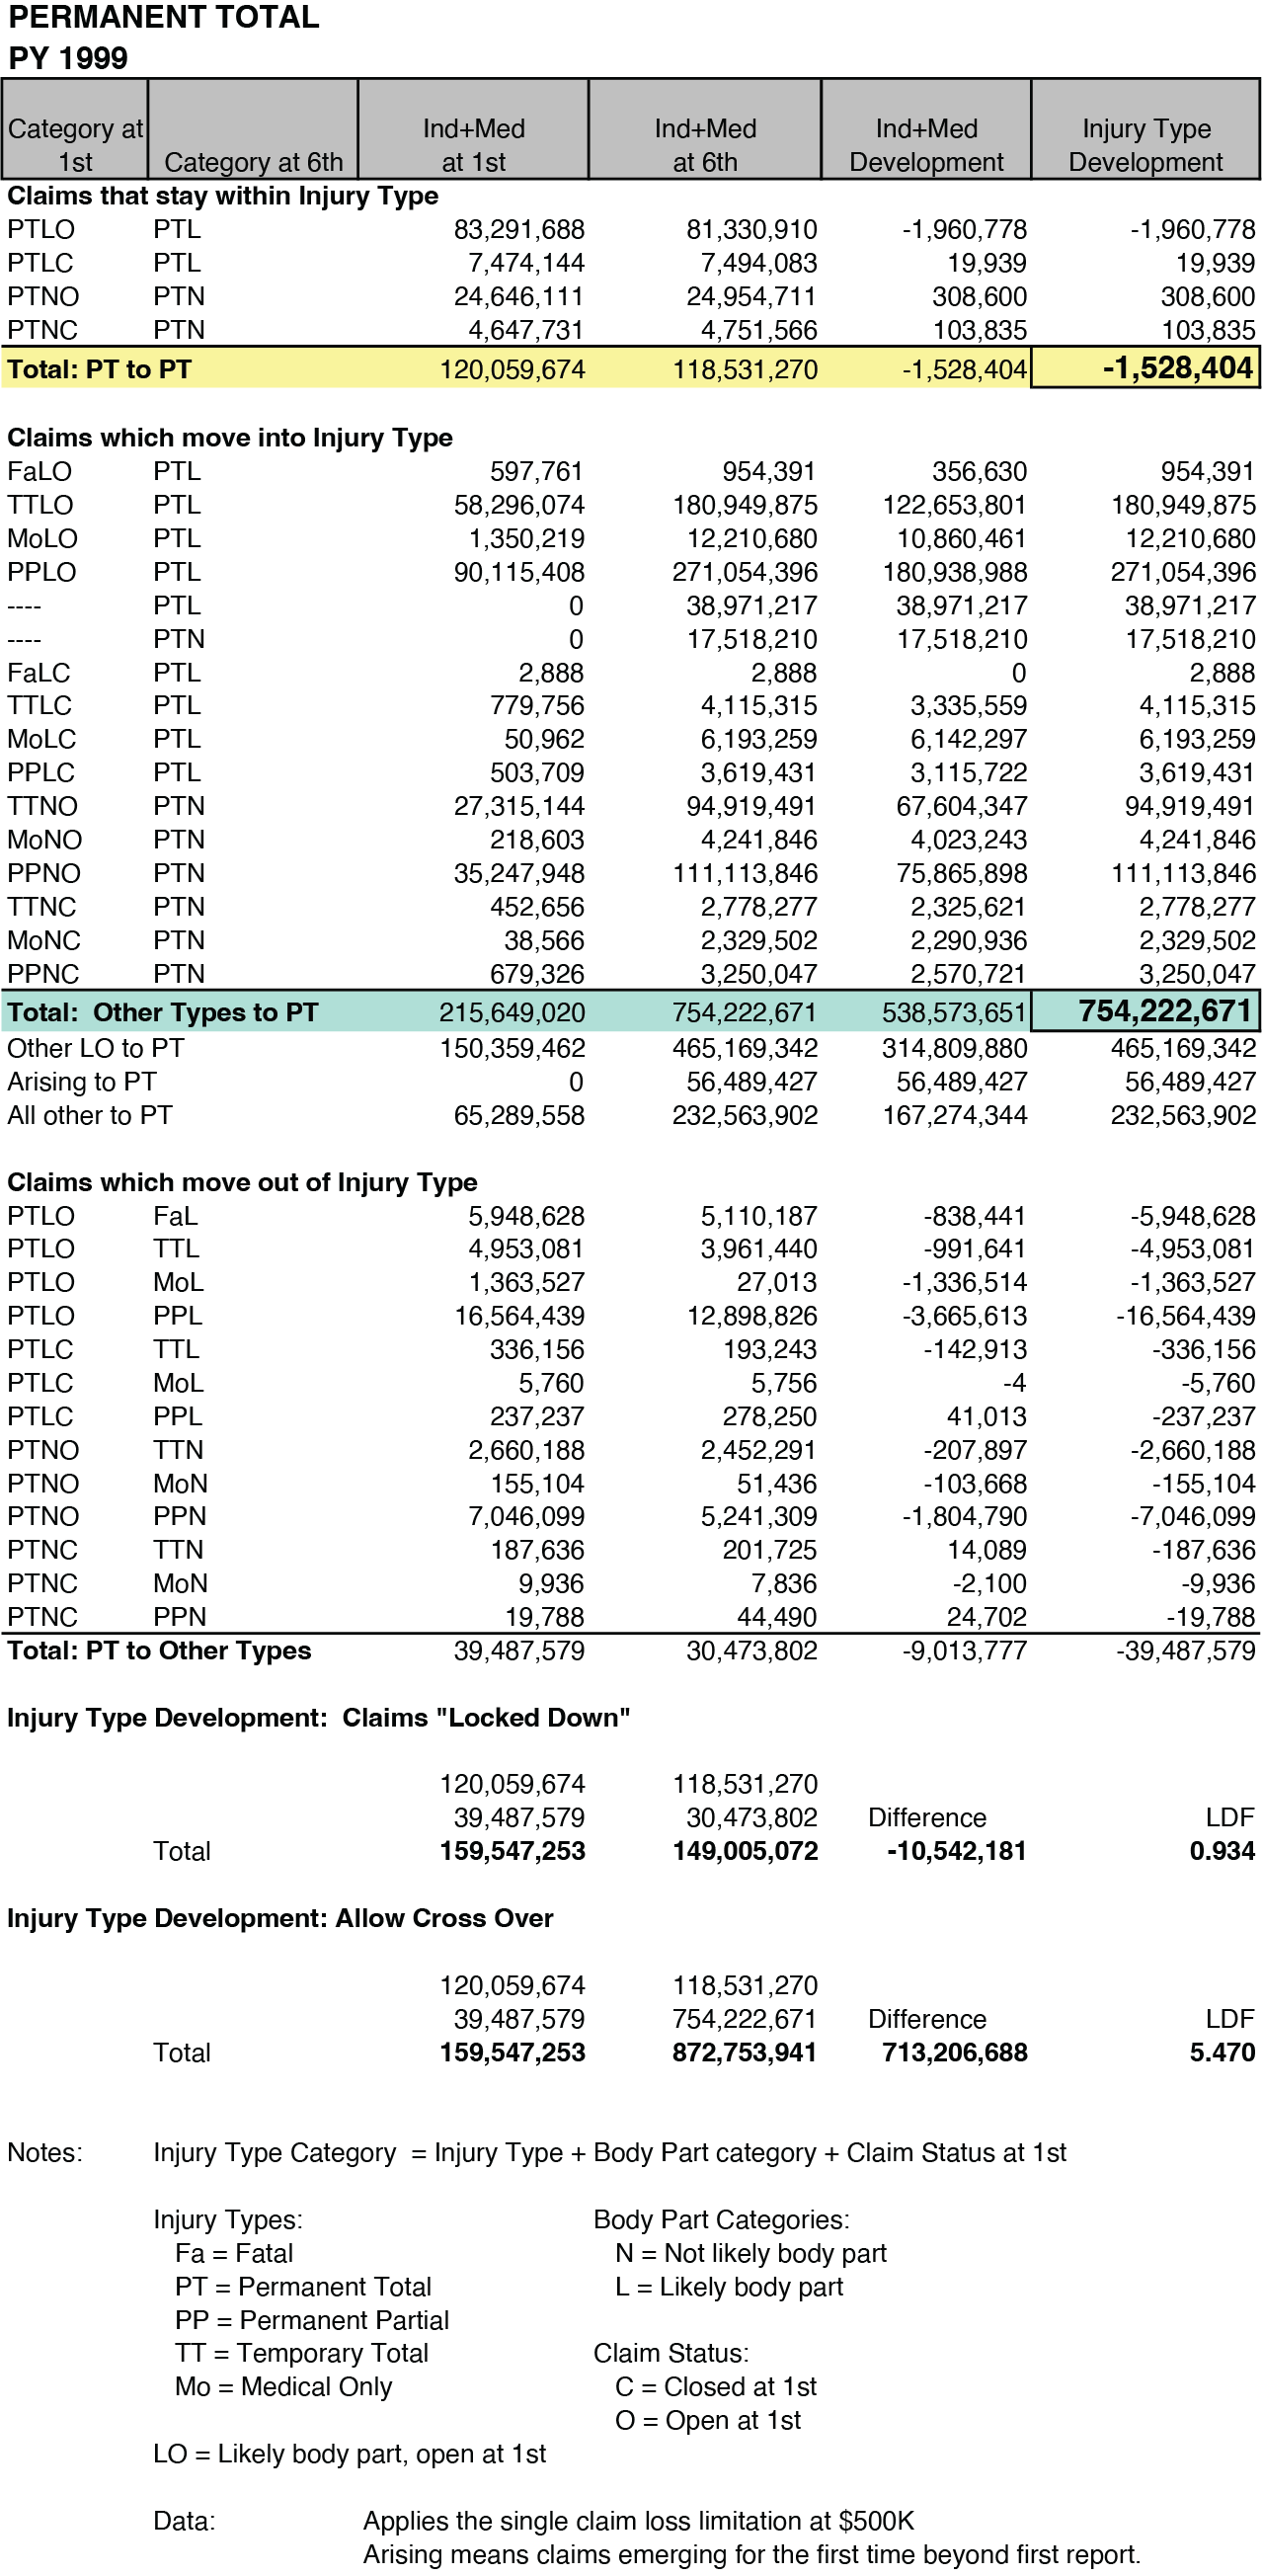
Observe in Figure 8a that claims from the permanent total (PT) and fatal (Fa) injury types demonstrate unique loss development characteristics. That is, the L and N body part categories do not discern loss development patterns as it does in other injury types. The LDF behaves in the opposite manner (i.e., L < N and C > O).
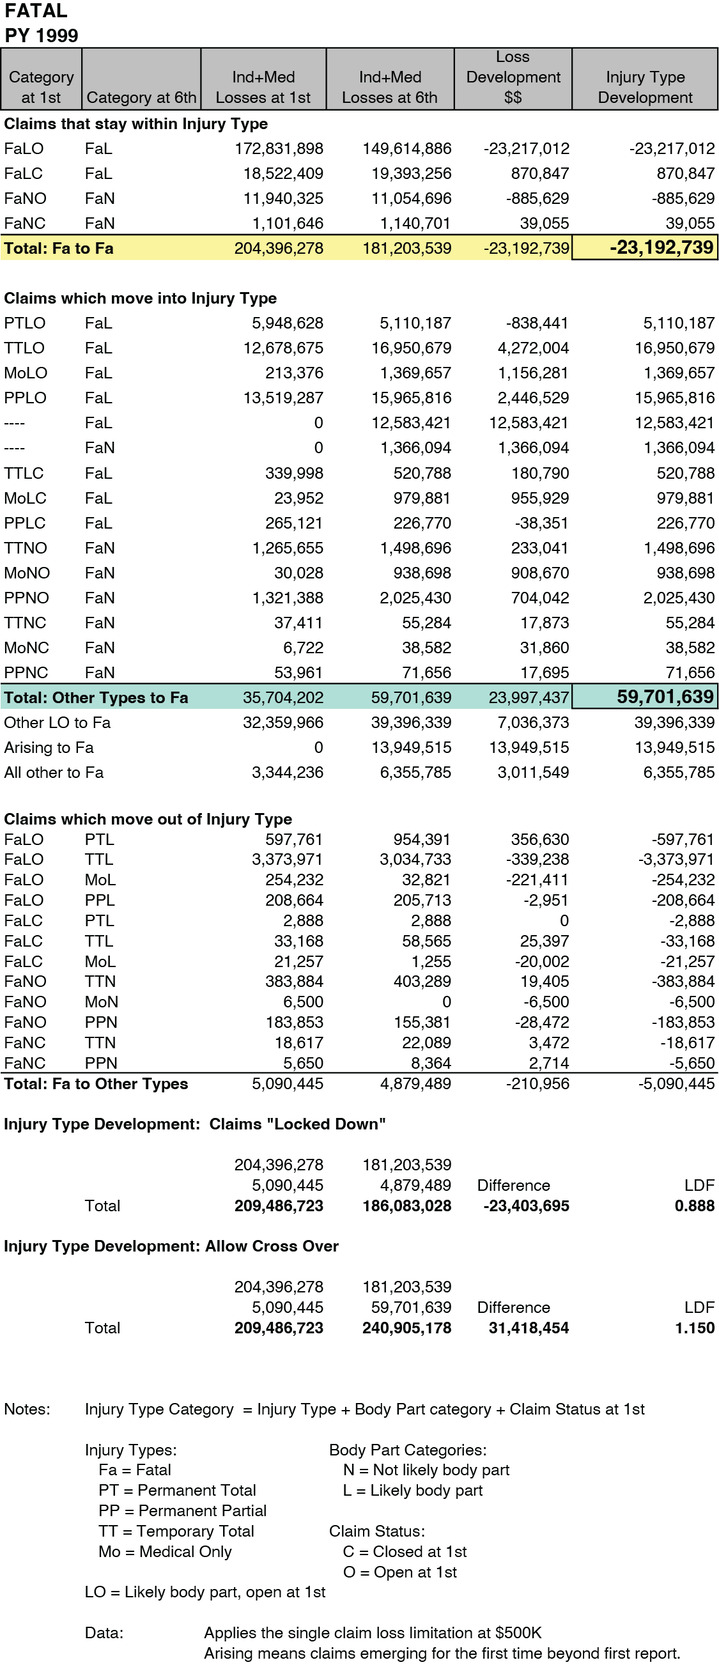
Research was conducted on the development patterns of fatal and PT claims. Because injury type “crossover” complicates the analysis, three subgroups of fatal and PT claims were created and the LDF observed (Figures 8c and 8d):
-
Those claims which remained within the injury type across all report levels.
-
Those claims which moved into the fatal and PT injury types after initially being reported as another injury type at first report.
-
Those claims which migrated out of the injury type at later reports after initially being reported as fatal and PT at first report.
__which_wer.png)
Three observations follow from these injury type “crossover” analyses.
First observation: Fatal claims at sixth report, which were reported initially as a fatality at first report, distinctly developed downward from first through sixth report (see top section of Figure 8c).
Conclusion #1: Move fatal claims at first report into the N grouping, and no longer assign them as likely-to-develop.
Reasoning: There is no need for carriers to estimate medical case reserves since the injured worker has died. The dependents receive indemnity benefits, defined as streams of payments over time in most states, and in a few states they also receive a pre-determined burial allowance.
Second observation: Claims which become fatalities at subsequent reports (second through sixth) developed significantly upward by about $60M after first report (see middle section of Figure 8c).
Conclusion #2: Claims which become fatalities at second and subsequent reports will be categorized in the L grouping.
Reasoning: A claimant’s condition deteriorates to the point where the injured worker dies, and fatal benefits are paid out. Large amounts of upward loss development dollars are observed, and it is often in the medical component.
Figure 8b, Option 2 demonstrates that a greater differentiation in LDF magnitude occurs, particularly for indemnity, when the fatal claims at first report were removed from the L grouping and placed in the N grouping. This is seen by comparing Option 2 to the groupings labeled ‘Original’ and ‘Option 1’ in the rows above it.
Conclusion #3: Categorize all PT claims into the L grouping for all reports.
Reasoning: Many PT claims were initially reported as another injury type, and conditions deteriorated to the point where the injured worker became permanently totally disabled. On Figure 8d, large amounts of upward loss development are observed.
Option 2 at the bottom of Figure 8b represents the selected final L grouping, which excludes fatalities at first report, includes all PT claims, and includes only likely-to-develop, open claims for PP and TT. The equation is:
L = Fatal - Fatal @ 1st + PT + PPLO + TTLO.
Finally, NCCI decided to keep all medical-only (MO) claims in the N grouping for two reasons: (a) less than 1% of all MO losses would shift to likely, and (b) some carriers report their entire inventory of MO claims as closed claims when reporting WCSP data to NCCI, which would be problematic.
2.5.5. The class ratemaking tail factor: Prior methodology
The tail factor in workers compensation presents a formidable challenge to NCCI actuaries. In aggregate ratemaking, in order to determine a state’s overall indicated loss cost/rate level change, a tail factor is estimated separately for indemnity and medical, and then attached currently at a 19th report. NCCI financial call data is used as the source data to a 19th report. However, only five reports of the WCSP data, the source data for class ratemaking, were required to be reported to NCCI by its affiliated carriers.
In the prior NCCI class ratemaking methodology, the financial tail factor was the starting point for the class ratemaking tail factor. NCCI assumed that 100% of loss development beyond the fifth report was due to development on serious claims, and 0% due to development on non-serious claims. Figure 2 shows how a class fifth—ultimate LDF was computed from the state financial data fifth—ultimate LDF, referred to below as Fin5U. The following formula was used for indemnity losses to determine the class ratemaking fifth—ultimate LDF, referred to as Class 5UI. It was applied to serious losses at fifth report.
Class 5U1=[SER1+(SER1+NS$1)∗(Fin5U1−1.000)2]SER$1
where
-
Class 5UI = Unlimited fifth–ultimate indemnity (I) tail factor applied to serious losses at fifth report. No tail is applied to non-serious losses;
-
Fin 5UI = Unlimited statewide financial data fifth–ultimate LDF for indemnity (I); and
-
SER$I = two years of unlimited “paid+case” serious indemnity loss dollars on-leveled and developed to fifth report for the state.
-
NS$I = two years of unlimited “paid+case” non-serious indemnity loss dollars on-leveled and developed to fifth report for the state
The same approach was also used to determine a fifth—ultimate tail factor for medical losses, but is not shown here. Only the subscript would change from (I) to (M).
By rearranging the formula, the following is derived:
Class 5UI=Fin5UI+[(NS$I/ SER I)∗( Fin 5UI−1.000)].
Formula (2.7) illustrates that the prior class tail factor was highly leveraged to the relative share of non-serious to serious loss dollars as determined by the critical value. The lower the statewide share of serious losses, the higher the prior class ratemaking tail factor became. By eliminating the critical value, and thus the serious and non-serious distinction, the new class ratemaking loss development methodology reduces this highly leveraged tail factor phenomenon.
2.5.6. The class ratemaking tail factor: New methodology
The tail factor under the new methodology uses analogous notation except the serious and non-serious groupings are replaced by likely-to-develop (L) and the not-likely-to-develop (N). Furthermore, the prior methodology assumed that all loss development in the tail beyond fifth report was due to serious claims only, which implied that 100% of the tail loss dollars were applied to serious and 0% applied to non-serious. NCCI is modifying this assumption so that a percentage of tail development, y, will be applied to the N grouping dollars of loss and (1-y) will be applied to the L grouping dollars of loss. This allows a portion of tail development to be applied to the not-likely-to-develop losses. Thus, two new class ratemaking tail factors are applied at the tth report, one for L and one for N.
The new methodology tail factor formulas may be written in a general form to account for the various tail attachment points and the new assumptions as follows:
Class UL,I=[L$I+(1−y)∗( L$I+N$I)∗(FintUI−1.000)]L$I
and
Class UN,I=[N$I+y∗( L$I+N$I)∗(FintUI−1.000)]N$I
where,
-
t = time t representing the report level of WCSP data at which the attachment point for the class ratemaking tail is applied, t = 5, . . . . , 10;
-
L$I = two latest years of limited (at $500K) likely-to-develop “paid+case” indemnity loss dollars on-leveled and developed to tth report for the state;
-
N$I = two latest years of limited (at $500K) not-likely-to-develop “paid+case” indemnity loss dollars on-leveled and developed to tth report for the state;
-
Class tUL,I = a likely-to-develop tth–ultimate indemnity (I) tail factor applied to likely-to-develop losses at tth report for each class code. It is limited at aggregate state threshold T;
-
Class tUN,I = a not-likely-to-develop tth–ultimate indemnity (I) tail factor applied to not-likely-to-develop losses at tth report for each class code. It is limited at aggregate state threshold T.
-
Fin tUI = limited (at T) aggregate statewide financial data tth–ultimate LDF for indemnity (I); and
-
y = percentage between 0% and 100% used to allocate a portion of tail development dollars to the not-likely-to-develop grouping.
Note all claims are limited at $500K at all report levels up to the tail attachment point under the new methodology. The Fin 5Ui LDF were unlimited under the prior methodology, but are capped at the state aggregate threshold T under the new methodology. The same approach is used to determine a tth—ultimate tail factor for medical losses, but is not shown here. Only the subscript would change from (I) to (M) within the formulas above.
Based on research observing actual WCSP loss development patterns through seventh report, NCCI is initially using a value of 20% for y for both indemnity and medical for all tail attachment points out to tenth report. Thus, 80% of the total dollars of tail development will be assigned to the likely-to-develop loss triangle, and 20% of the dollars assigned to the not-likely triangle.
From an analysis of several states, the pro-rata loss share for L and N is much closer to 50% each than was the share of losses for serious and non-serious. This reduces the leverage on the class tail factor and produces more tail stability from year to year.
The tail factor is an area that warrants continued research. Possible future enhancements are that y could vary between indemnity and medical or y could vary as the tail attachment moves out toward tenth report. For example, at fifth report, y may be a higher percentage than what y would be at tenth report.
2.5.7. Summary of the new loss development proposal
Under NCCI’s new loss development methodology, claim dollars are assigned to one of the following four development categories for each state:
-
Medical—Likely-to-Develop
-
Medical—Not-Likely-to-Develop
-
Indemnity—Likely-to-Develop
-
Indemnity—Not-Likely-to-Develop
This assignment is a function of three claim characteristics: (1) injury type, (2) part of body, and (3) claim status (open vs. closed). NCCI also modified the loss development methodology from fifth-ultimate. Table 1 summarizes the combinations of claim characteristics used to assign claims to their appropriate groups. It introduces the terminology Part of Body (POB) Group A and Group B to refer to the mapping of body parts to the likely-to-develop (L) and the not-likely-to-develop groupings (N), respectively. Group A consists of claims having a greater potential to develop upward over time such as injuries to the back, head, lungs, heart, shoulders, trunk, and multiple body parts. Group B consists of the others.
Table 1 illustrates the claim status (open vs. closed) and body part, each evaluated at first report, which is used for the purpose of determining the development category. Not all claims are “locked in” their development grouping, however. At subsequent reports (second through tenth), changes in injury type are monitored for the purpose of potentially reassigning a few claims to a different development grouping.
For claims in which there is no first report, but that are reported at second report or subsequent, they will be assumed to be open at first report for the purpose of development category assignment. The body part and claim status are based upon the initial report submitted to NCCI, while the injury type is monitored at all reports for appropriate grouping determination.
The new loss development methodology will significantly reduce, but not completely eliminate, instances of crossover from one development grouping to the other. The following list provides common examples of how crossover may occur under the new methodology in certain injury types:
-
Medical Only (MO)—MO claims in POB Group A, open at first report, which migrate to another injury type at a later report, will move from N to L.
-
Temporary Total (TT) or Permanent Partial (PP)—Crossover can occur on TT or PP claims, originally categorized in the N grouping, which evolve into a PT or fatality at a later report.
Exhibits 2–4 in the Appendix illustrate loss triangles and the class tail calculation using the new loss development methodology.
2.5.8. Advantages and disadvantages of the new loss development groupings
The most important advantage the new loss development methodology provides is more predictive and stable LDFs. Expanding the triangles out to tenth report also improves the predictive ability. Most crossover has been mitigated due to the elimination of the critical value, and the new data element combination of body part, injury type, and claim status has improved the LDF groupings. Most importantly, class equity improves as the class codes with more head, back, trunk, multiple body, etc. injuries will have higher loss costs than class codes with less complex injuries, all else equal. Class loss costs become more equitable.
The use of injured body part in conjunction with the open and closed claim status is a logical combination that most regulators, actuaries, and non-actuaries should readily understand.
The only disadvantage the new methodology has is that as claims evolve over time and change injury types, a small amount of dollar crossover from one grouping to another occurs. Certain changes in the reported injury type for a given claim are a natural progression in workers compensation that NCCI chooses to reflect within the new loss development structure.
2.6. Loss limits, expected excess, and the new hazard group mapping
The prior class ratemaking methodology limited large claims for a class code at a loss limit equal to five times the state’s serious average cost per case. For NCCI states, these limits ranged from $300,000 to about $1.1M during the 2006 filing season. A multiclaim occurrence was capped at twice the single claim limit. The excess dollars removed from the individual class codes were distributed to the industry group to which the class code belonged. This was done by deriving an unlimited-to-limited ratio for each industry group within the industry group differential calculations. Summarizing, the prior class ratemaking methodology limited large claims on a class code level, but unlimited loss dollars were used in deriving LDFs and industry group differentials.
The most noteworthy changes in the new class ratemaking methodology are:
-
Standardizing the single claim loss limit for class codes to be $500,000 in each state (and the multiclaim occurrence limit is now three times the single claim limit).
-
Basing LDFs on claims limited at $500,000.
-
Applying a multiplicative factor to estimate the expected losses in excess of $500,000 using excess ratios from the new seven hazard group mapping (Corro and Engl 2006 and Robertson 2009).
-
Removing the unlimited-to-limited ratio from the class code conversion factors and from the industry group differential calculations, and replacing it with expected excess dollars summed across all class codes within each industry group.
-
Computing the indicated losses within each industry group is the sum of the limited ultimate losses and the excess dollars referenced in step (4).
Limited loss amounts for claims above the threshold are allocated to indemnity and medical in the proportion that their values contribute to the total unlimited value of the claim.
2.6.1. Application of the excess ratios
Excess losses are defined as the sum of the excess portion of claims above a given per claim threshold. NCCI produces excess ratios with each loss cost or rate filing. NCCI redefined its excess ratios in 2004 to exclude the cost of events $50M or greater, the new catastrophic event threshold. For a detailed discussion of the methodology underlying NCCI excess ratios, see Engl and Corro (2006).
The excess ratio, XST, for a given threshold T, T < $50M, is defined as
XST= Expected Excess Losses Between Threshold T and $50M Expected Total Losses Below $50M
The ratio of excess losses to total losses is at an ultimate value. In class ratemaking, excess ratios are applied to calculate full value ultimate losses from limited ultimate losses. The threshold T for capping claims in every class code is currently $500,000, uniform in all states. The actual excess dollars greater than $500,000 are removed from class ratemaking.
The excess ratio applied is on a per-claim basis and varies by state and hazard group. This differs from an excess loss factor as excess loss factors are on a per-occurrence basis, and also may include a provision for expenses.
The adjusted, per-claim excess ratio is applied as a factor, 1/(1 − XS500K), to a class code’s limited (@500K) ultimate losses that have been developed, on-leveled, and trended to the midpoint of the proposed filing effective period. Similarly, the excess ratio applied has also been trended to the midpoint of the proposed filing effective period.
NCCI uses five policy periods as the experience period for each class code. For each policy period, the same factor 1/(1 − XS500K) is applied to both indemnity and medical losses, since the size-of-loss distributions for excess ratios are on a combined indemnity and medical basis.
In 2006, NCCI completed an analysis of countrywide excess ratios by class code, and a new mapping of class codes to seven hazard groups was implemented (previously there were four). The seven hazard groups range from A to G. Class codes having the highest excess ratios were mapped to G, considered the most hazardous classes. Class codes having the lowest excess ratios were mapped to A, considered the least hazardous classes. See Robertson (2009) for more detail.
Excess ratios for all seven hazard groups are updated annually for every state. The allocation of expected excess dollars to class codes by hazard group is an excellent refinement in the new class ratemaking because
-
Expected excess provisions are more stable from year to year than the prior unlimited-to-limited ratio approach, which was based upon five years of actual large loss amounts.
-
Excess losses are distributed to class code more equitably via hazard group than industry group.
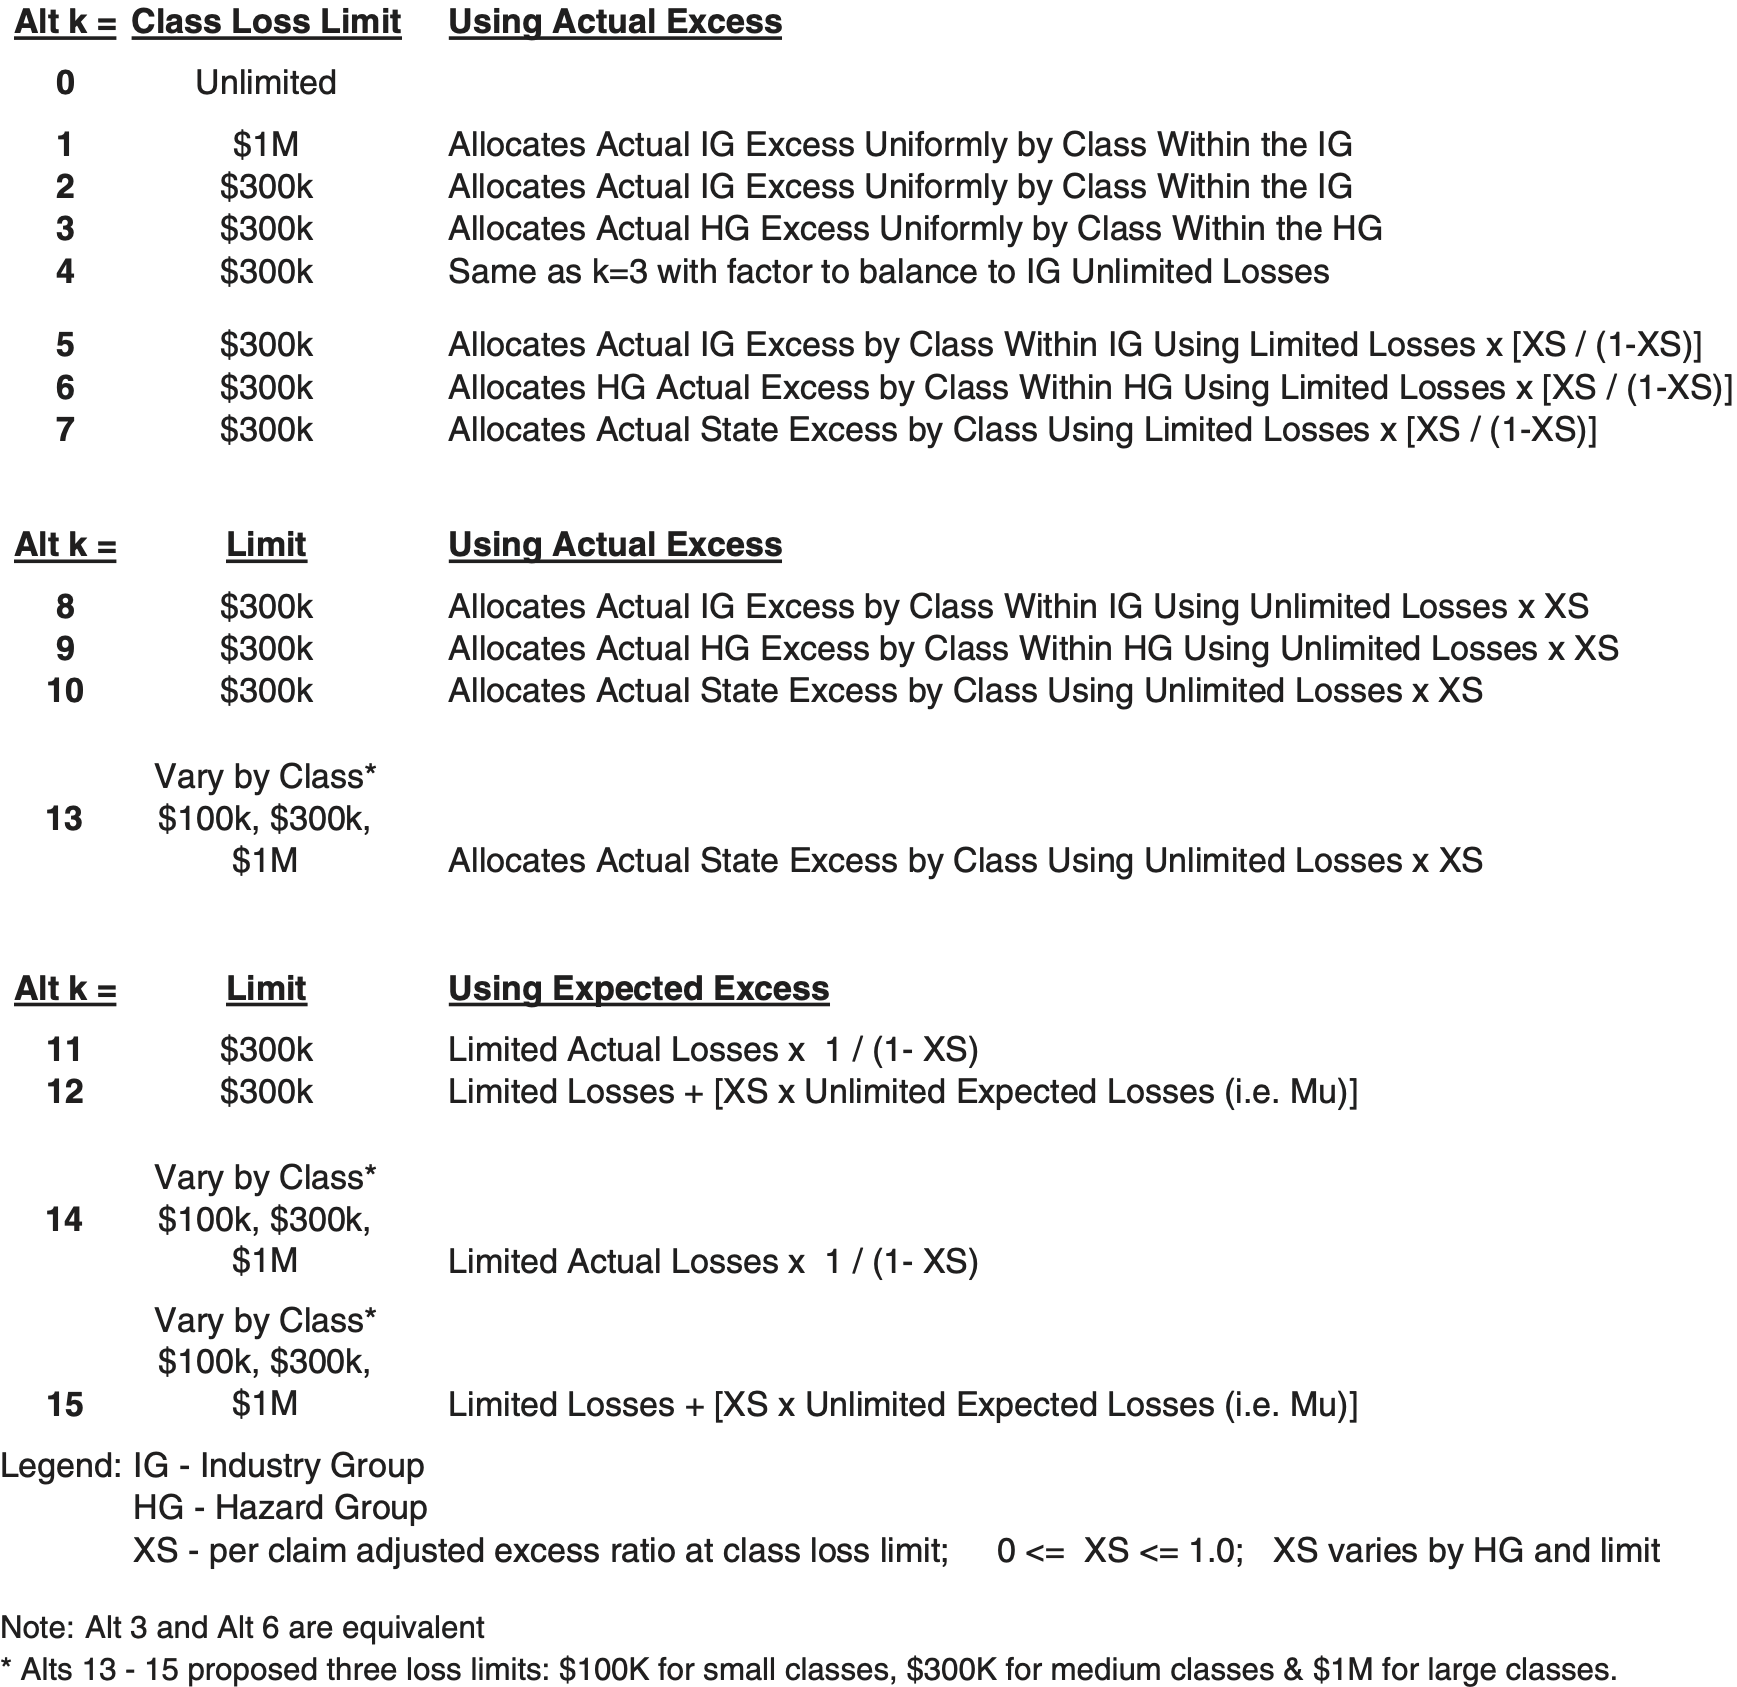
2.6.2. Simulation and expected excess
Results from 16 different potential capping and excess-spreading alternatives were explored using a Monte Carlo simulation technique. Figure 9 illustrates all of the options considered and analyzed.

The simulation approach of testing the alternatives was completed as follows:
-
Five years of simulated losses were produced for every class code in two large states and two small states.
-
The claim counts were based on actual national incidence rates for the class code. A Poisson distribution was assumed with lambda equal to the national incidence rate by injury type multiplied by the actual payroll for the class in each state.
-
The excess loss distributions by injury type by state (Corro and Engl 2006) were used for determining the average cost per case. In determining the state distributions, each class was scaled to the state’s average cost per case adjusted for hazard group.
-
One hundred different simulation trials by class code were produced. Each simulation generates five years of unlimited loss data for the given class.
-
The simulated claims’ loss data was then modified by the specific capping and excess spreading alternative in Figure 9 to provide modified expected unlimited losses.
-
The performance of each alternative was assessed using four metrics. Two of the metrics measured loss cost adequacy and two measured loss cost stability across the 100 simulation trials.
The following four metrics were used to assess the success of the various alternatives for limiting claims and allocating the excess loss.
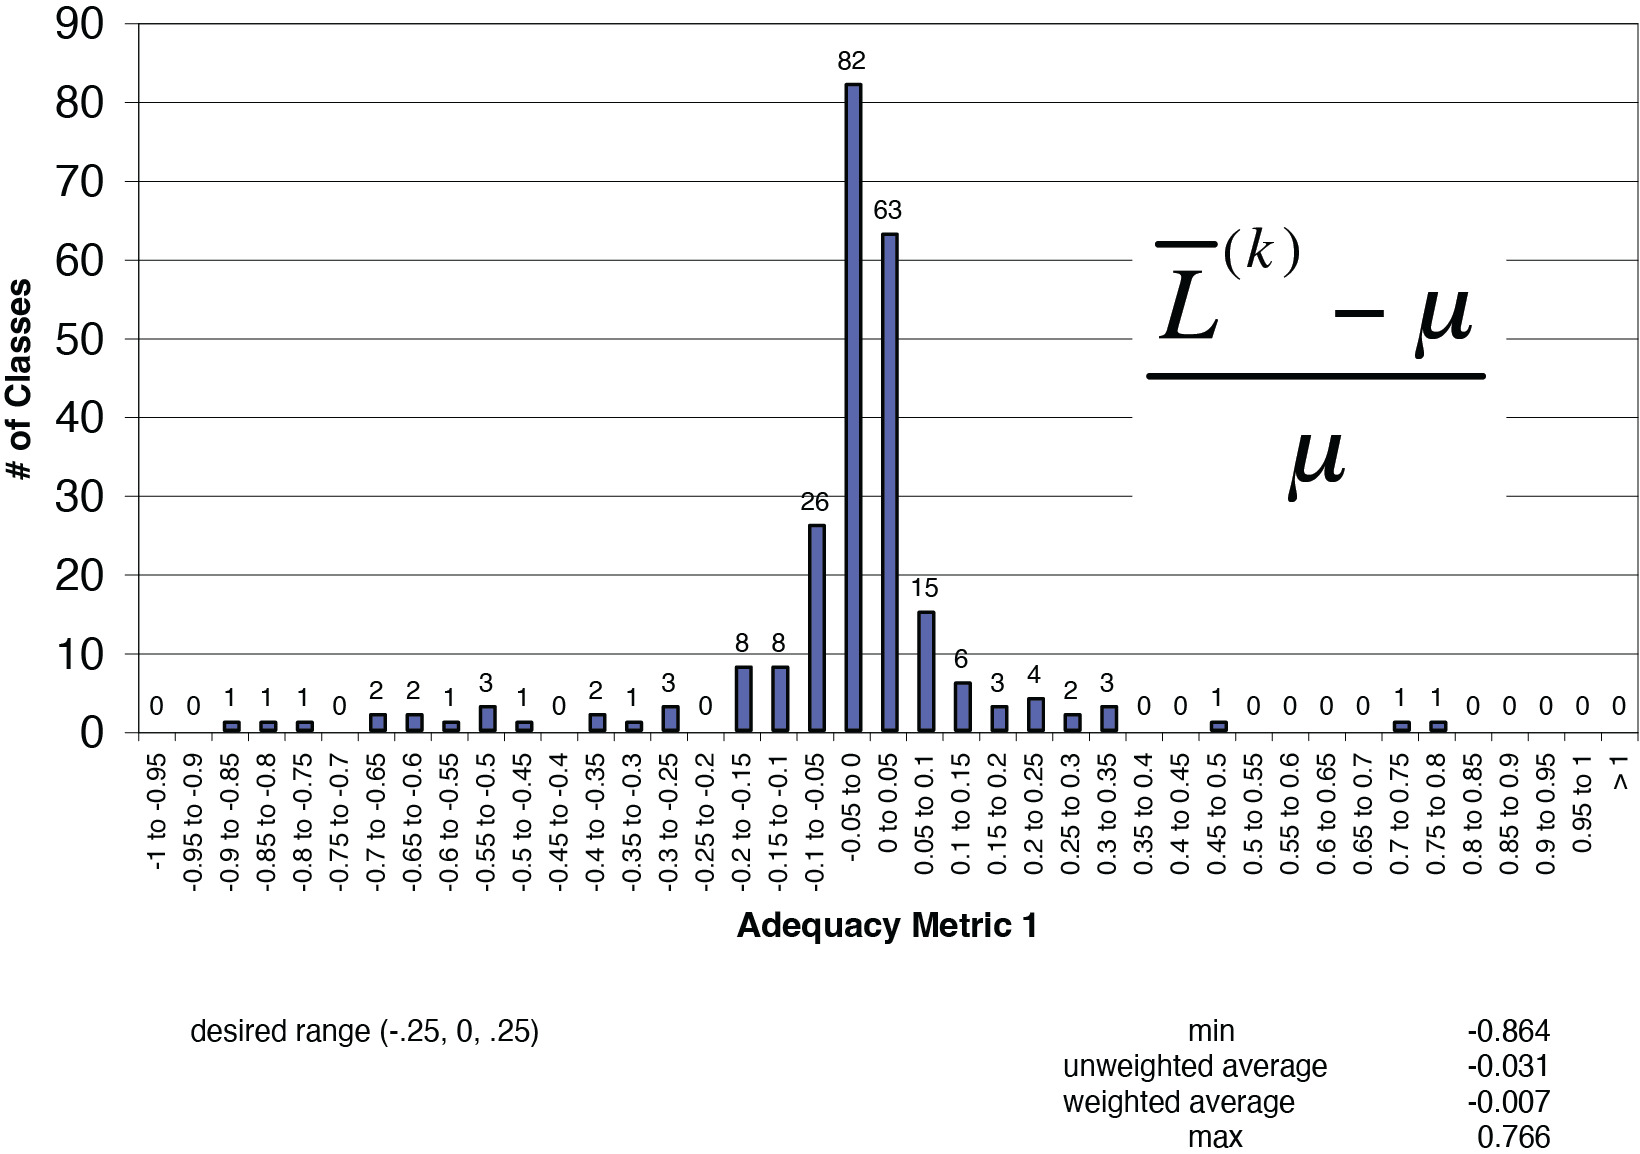
Adequacy Metric 1: Desired range [−0.25, +0.25]
ˉL(k)−μμ
where
-
Ln = 5 years of simulated losses for the nth trial whereby n = [1, 2, . . . . , 100],
-
Ln(k) = 5 years of simulated losses for the nth trial whereby the losses were capped as in alternative k for limiting losses and allocating the excess (see Figure 9 for alternatives),
-
µ = hypothetical mean mu, the expected losses for a class code based on simulated frequency and actual severity times actual class payroll for that state, and
-
L(k) = the average losses for a specific class code over N simulations for alternative k.
Mathematically, it equals:
ˉL(k)=(N∑n=1L(k)n)/N
Adequacy Metric 2: Desired range [0, +0.50]
=N∑n=1|L(k)n−u|/100u
This metric differs from the first in that the high and low values cannot cancel out due to the absolute value.
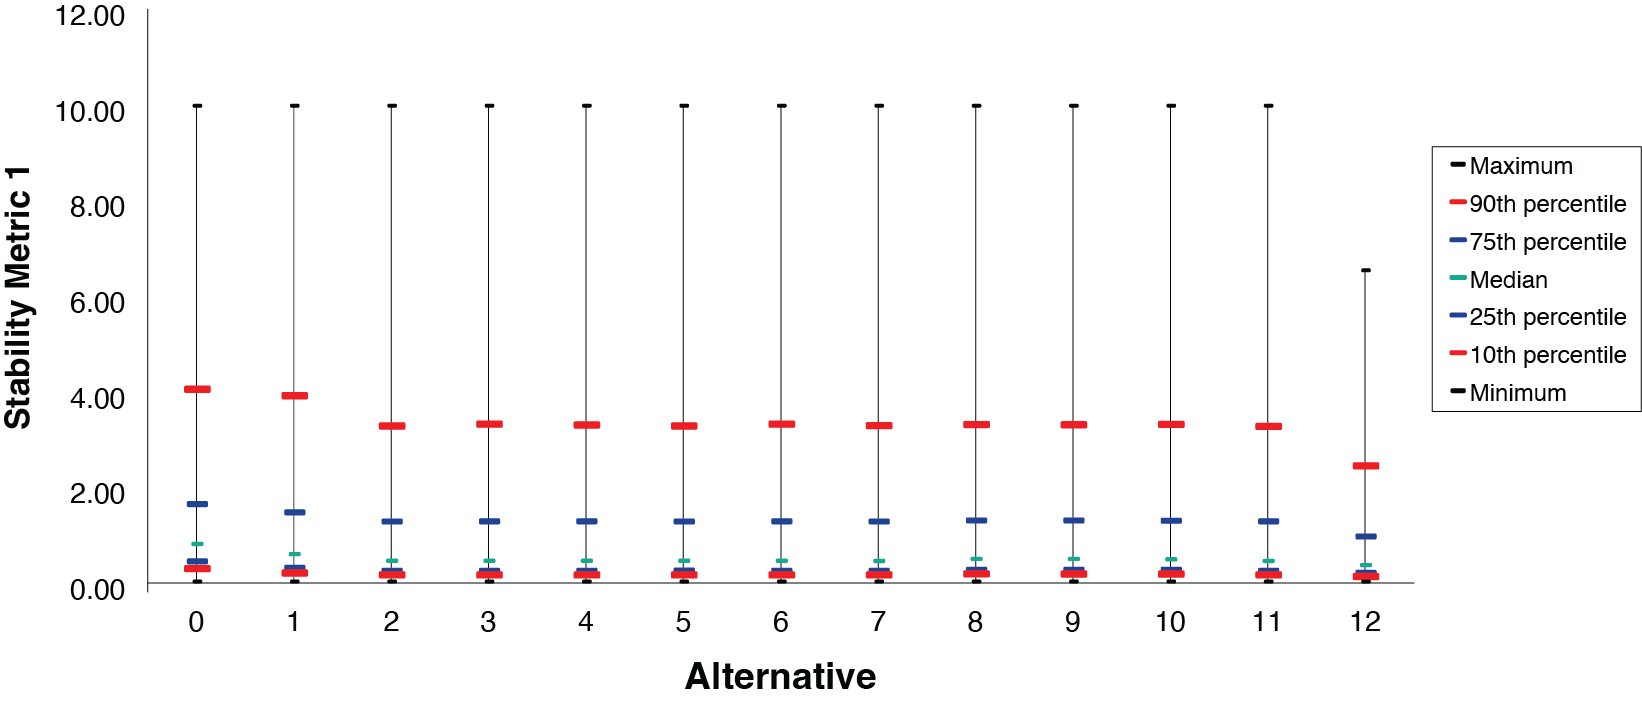
Stability Metric 1: Desired range [0, +0.10]
CV(k)c= standard deviation mean =√∑Nn=1(L(k)n,c−ˉL(k)c)2N¯L(k)c
where
-
CVc(k) = the coefficient of variation for class code c under alternative k,
-
Ln,c(k) =5 years of simulated losses for the nth trial for class c whereby the losses were capped as in alternative k, and
-
Lc(k) = average of simulated losses for alternative k over all simulations.
Stability metric 1 is the coefficient of variation for a specific class under the conditions of alternative k.
Stability Metric 2: Desired range [0, +0.50]
∑n,n|L(k)n,c−L(k)m,c|ucN(N−1)
where
-
Ln,c(k) = 5 years of simulated losses for the nth trial for class c whereby the losses were capped as in alternative k,
-
Lm,c(k) = 5 years of simulated losses for the mth trial for class c whereby the losses were capped as in alternative k, and
-
µc = hypothetical mean expected losses for a class code based on simulated frequency and actual severity times actual class payroll for that state.
For the performance measurement of stability metric 2, the average absolute change in losses for a class is computed across all combinations of the 100 simulations for each alternative k.
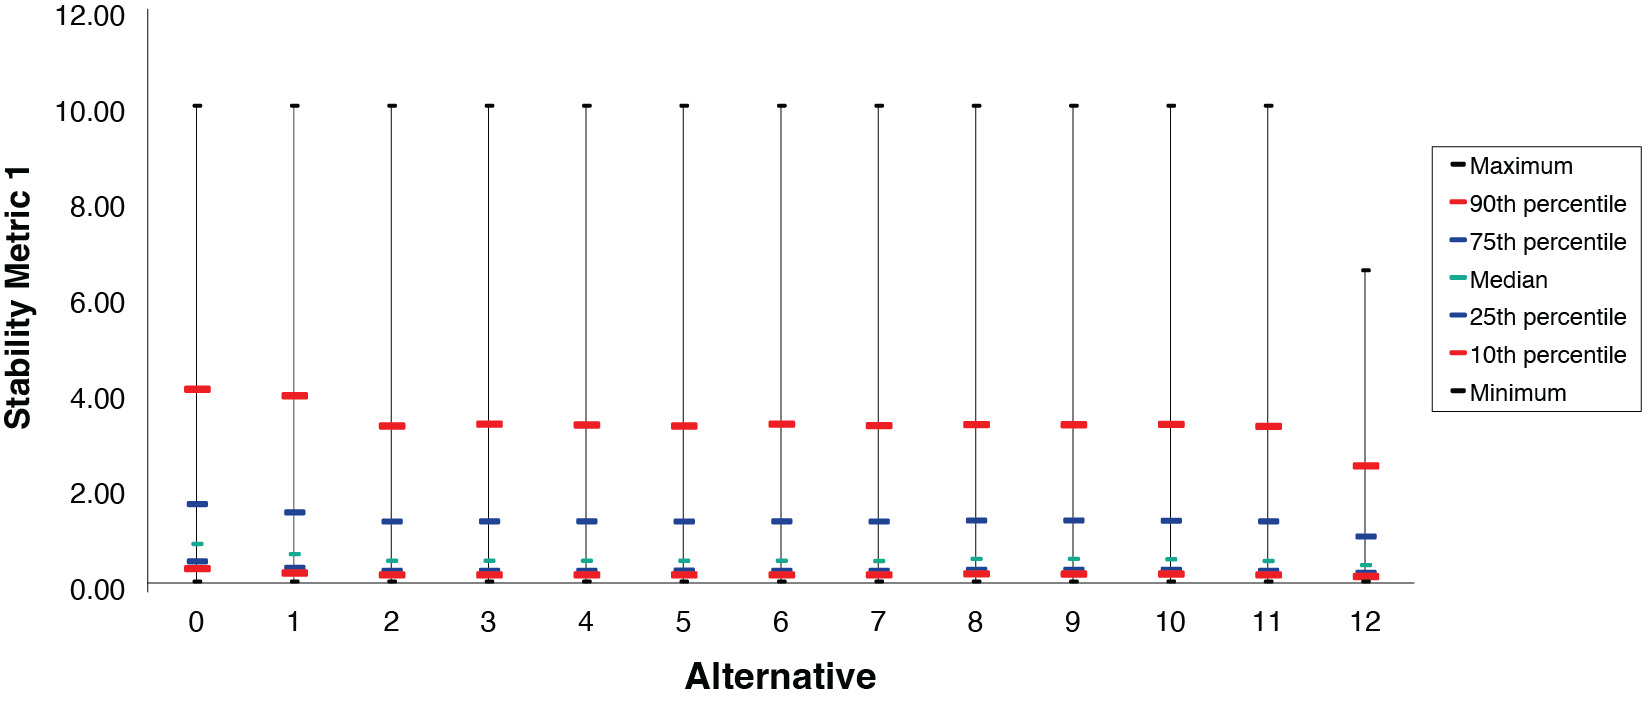
2.6.3. Choosing the final alternative for capping claims and allocating excess losses
Figure 10 provides two illustrative examples of the type of exhibits that were generated and observed for all four of the metrics for each state. Several statistics were analyzed, such as minimum and maximum values, the classes which comprised these outliers, and various different percentile levels such as the 90th, 10th, and the median. It was noted which alternatives were succeeding the most and which ones were not. Outlier classes were sometimes reviewed, and often a class that performed poorly contained little data. Typically, the outlier class had no losses for almost all of the simulation trials. This is a real-life challenge that the various class credibility formulae attempt to address.
The final two loss limits NCCI considered were $300,000 and $500,000. The $1M loss limit was eliminated based on class stability considerations and it would have increased the loss limit significantly in most states. The expected excess factors observed at $300,000 were very large upon reviewing the results of indicated pure premiums by class code in states with high excess ratios. This made $300,000 a less attractive choice.
The choice of the $500,000 limit provides a nice balance between allowing a significant amount of actual loss experience of the class code into the pure premium calculation combined with less reliance on the expected excess provision. For most states, it is significantly lower than the loss limit used in the prior methodology—five times the state serious average cost per case (SACC). NCCI observed that the 95th percentile of all countrywide large claims over a five year period was 2.5 times the SACC, one-half of the prior methodology’s loss limitation. $500,000 was selected after trending that value forward to the implementation date in 2009 and further consideration that the loss limit coincides with the limit on the NCCI Large Loss Call #31. The loss limit may be updated for inflation periodically after observing results of the new methodology.
After reviewing the indicated pure premiums derived under the best performing alternatives for several states, Alternative 11 was selected by NCCI for allocating excess losses (over $500K) to classes because
-
Alternative 11 performed exceptionally well on the four metrics;
-
The use of the multiplicative excess factor, 1/(1 − XS500K), is consistent with the methodology used for determining the overall statewide indicated loss cost change;
-
Given two class codes of similar size within the same hazard group and state, the class with greater primary losses would receive a greater proportional share of excess losses under Alternative 11;
-
After application of the 3-way pure premium credibility procedure, Alternative 11 produced comparable results to the other leading alternatives.
2.6.4. Transfer of excess loss dollars from indemnity to medical
As varying amounts of credibility are assigned separately for indemnity and medical pure premiums in the new class ratemaking methodology, a refinement is made to account for the fact that the majority of excess loss in workers compensation is due to the medical component. Because the excess ratios are produced on a combined indemnity and medical basis, the indemnity and medical distribution of excess losses, when calculated under Alternative 11, is equivalent to the primary split of indemnity and medical losses for every class code. Figure 11 was prepared to determine if this was appropriate.

For each class code, NCCI initially applies the factor 1/(1 − XS500K) to indemnity and medical primary (below $500,000) losses separately to compute the correct total excess dollar amount. Secondly, 40% of the total excess dollars produced within the indemnity pure premium component are transferred to the medical pure premium component for each class. The reasons for transferring 40% of the indemnity excess dollars to the medical component are:
-
More excess dollars are justifiably allocated to medical.
-
It preserves state and class differences as it is a function of the actual primary indemnity and medical split.
-
It achieves the desired higher proportion of medical excess (i.e., close to the 70% figure across all states combined).
-
It prevents a medical excess provision percentage from being less than the medical primary provision percentage for any class or state.
2.6.5. Implications on the industry group (IG) differential methodology
NCCI is maintaining its IG differential methodology, which is very similar to how it was done under the prior methodology. The value that the IG differential calculation adds to class ratemaking is:
-
It reflects wage trend differences by industry group.
-
The IG rate change is applied to determine the present-on-rate-level pure premiums, which are important for low credibility class code pure premiums.
-
It was the point where losses were brought to an unlimited basis in the previous methodology.
Oversimplified, the IG differential is a ratio of five years of indicated losses to five years of expected losses, both brought to the proposed level. The ratios by IG are normalized to unity. As a result of the new methodology, certain changes are addressed within the calculations:
-
The unlimited-to-limited ratio by IG is removed.
-
The indicated losses (limited at $500K) are developed to an ultimate level using the new loss development groupings.
-
The ultimate indicated losses limited at $500K are brought to an expected unlimited level via the multiplicative excess factor.
-
40% of the indemnity excess loss is transferred to medical.
-
The full credibility standard is changed to 12,000 lost-time cases. It previously ranged from 7,000 to 11,000 by IG. For more details, see Daley (2009).
An example of NCCI’s new IG differential calculation is found in the Appendix.
3. What is the impact of the methodology changes?
NCCI implemented the new methodology in loss cost and rate filings effective October 1, 2009, and subsequent. It has been adopted in all 37 states in which it’s been filed. Near the end of the first filing season, NCCI analyzed the results of the first 30 states in which the new methodology was filed. Because the 2009/2010 filing season was the transition year from the prior methodology to the new, the new methodology changes were introduced into the indicated pure premiums in year one. After all of the states were filed in year one, the national pure premiums were updated for the new methodology in preparation for the 2010/2011 filing season (i.e., year two). This approach gradually introduced the methodology.
3.1. First-year results
The following analysis represents the results achieved during the first NCCI filing season across the first 30 states that approved the methodology. Note the following caveats:
-
NCCI staff has not run the states with the prior and new methodology using the same five policy years of WCSP data.
-
This analysis shows both the prior-to-new methodology changes and the class experience changes that naturally occur from year to year. Hence, experience changes may have offset or added to the impact of the new methodology.
Results are observed across industry groups, hazard groups, and class codes. Each state’s values are given equal weight. The following relative change metric is used to generate observations in every state:
Relativity = Industry Group (or Hazard Group or Class Code) Loss Cost Change Overall Statewide Loss Cost Change
3.2. Industry group (IG) and hazard group (HG) results in the first year
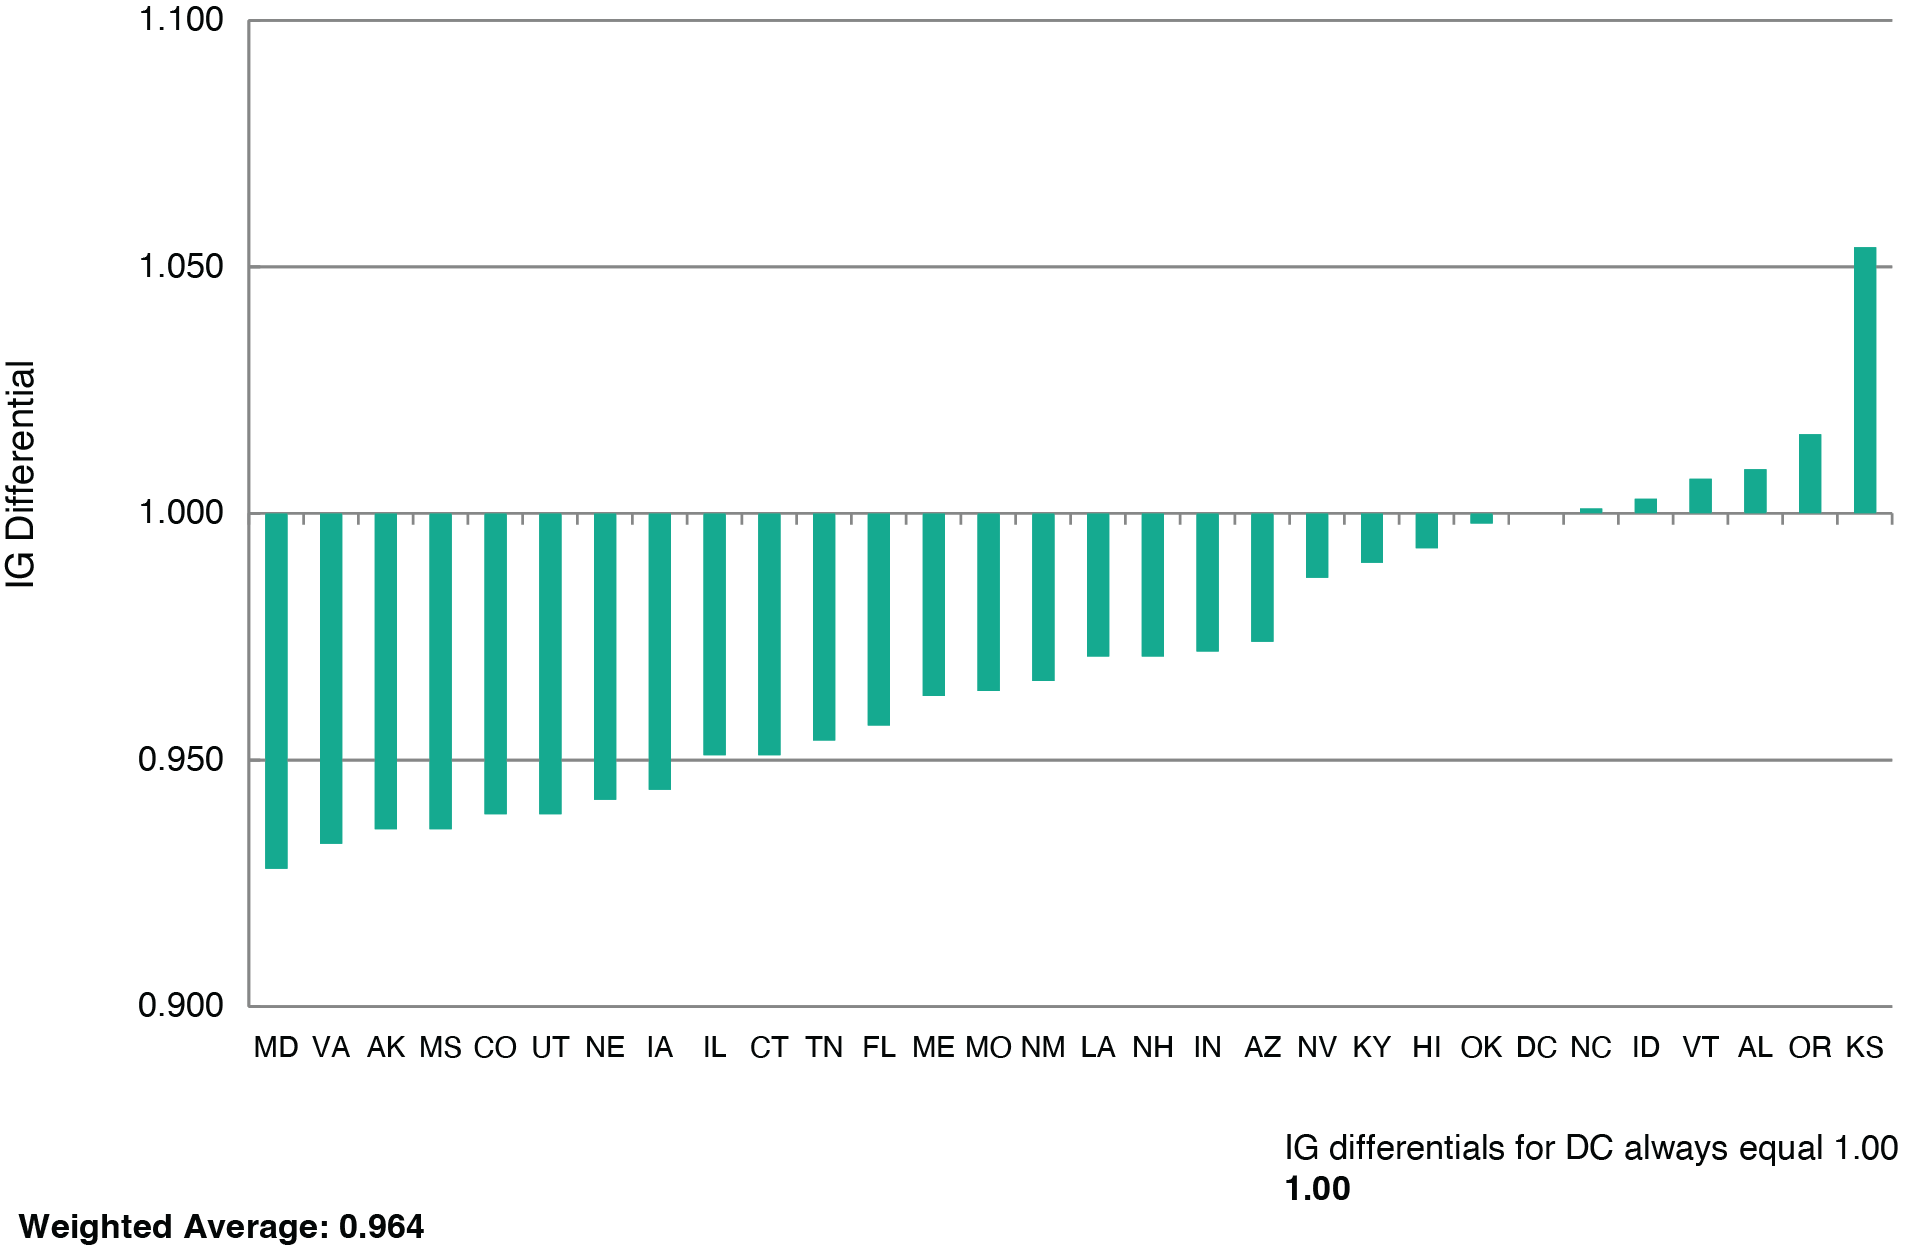
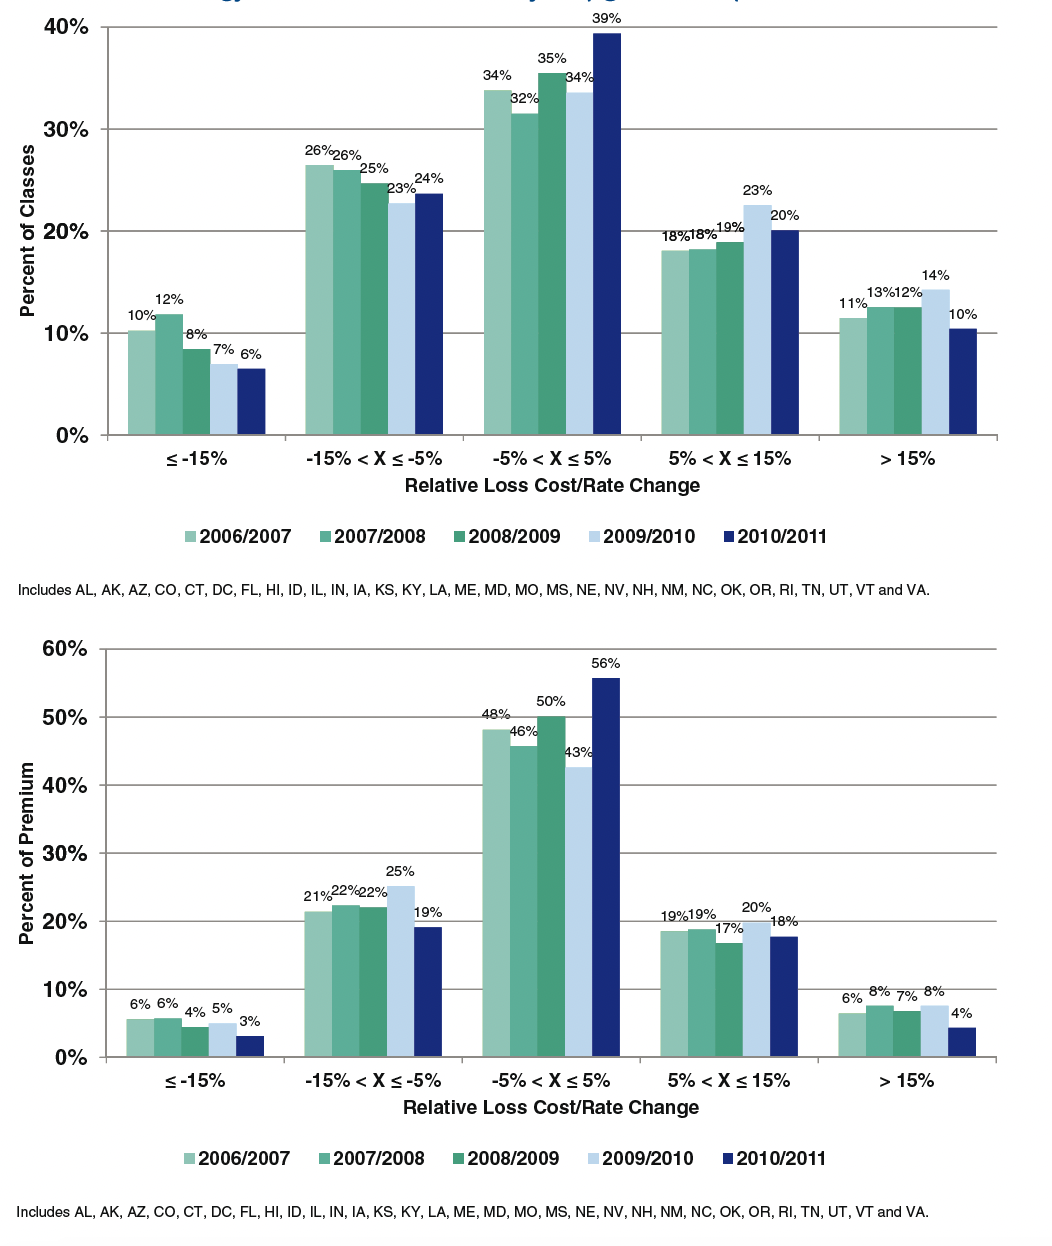
NCCI studied the methodology changes extensively after both the implementation year and year two. NCCI’s class ratemaking methodology targets loss cost changes at an IG level by state. Figures 12a and 12b provide IG differentials or relativities based upon (3.1).


These results are primarily because:
-
Due to the high severity nature of contracting classes, the prior critical value methodology generated a higher proportion of serious losses within contractor classes. The serious LDFs then overdeveloped these losses.
-
The Goods & Services classes consisted of higher proportions of non-serious losses, which were underdeveloped in the prior methodology by the non-serious LDFs.
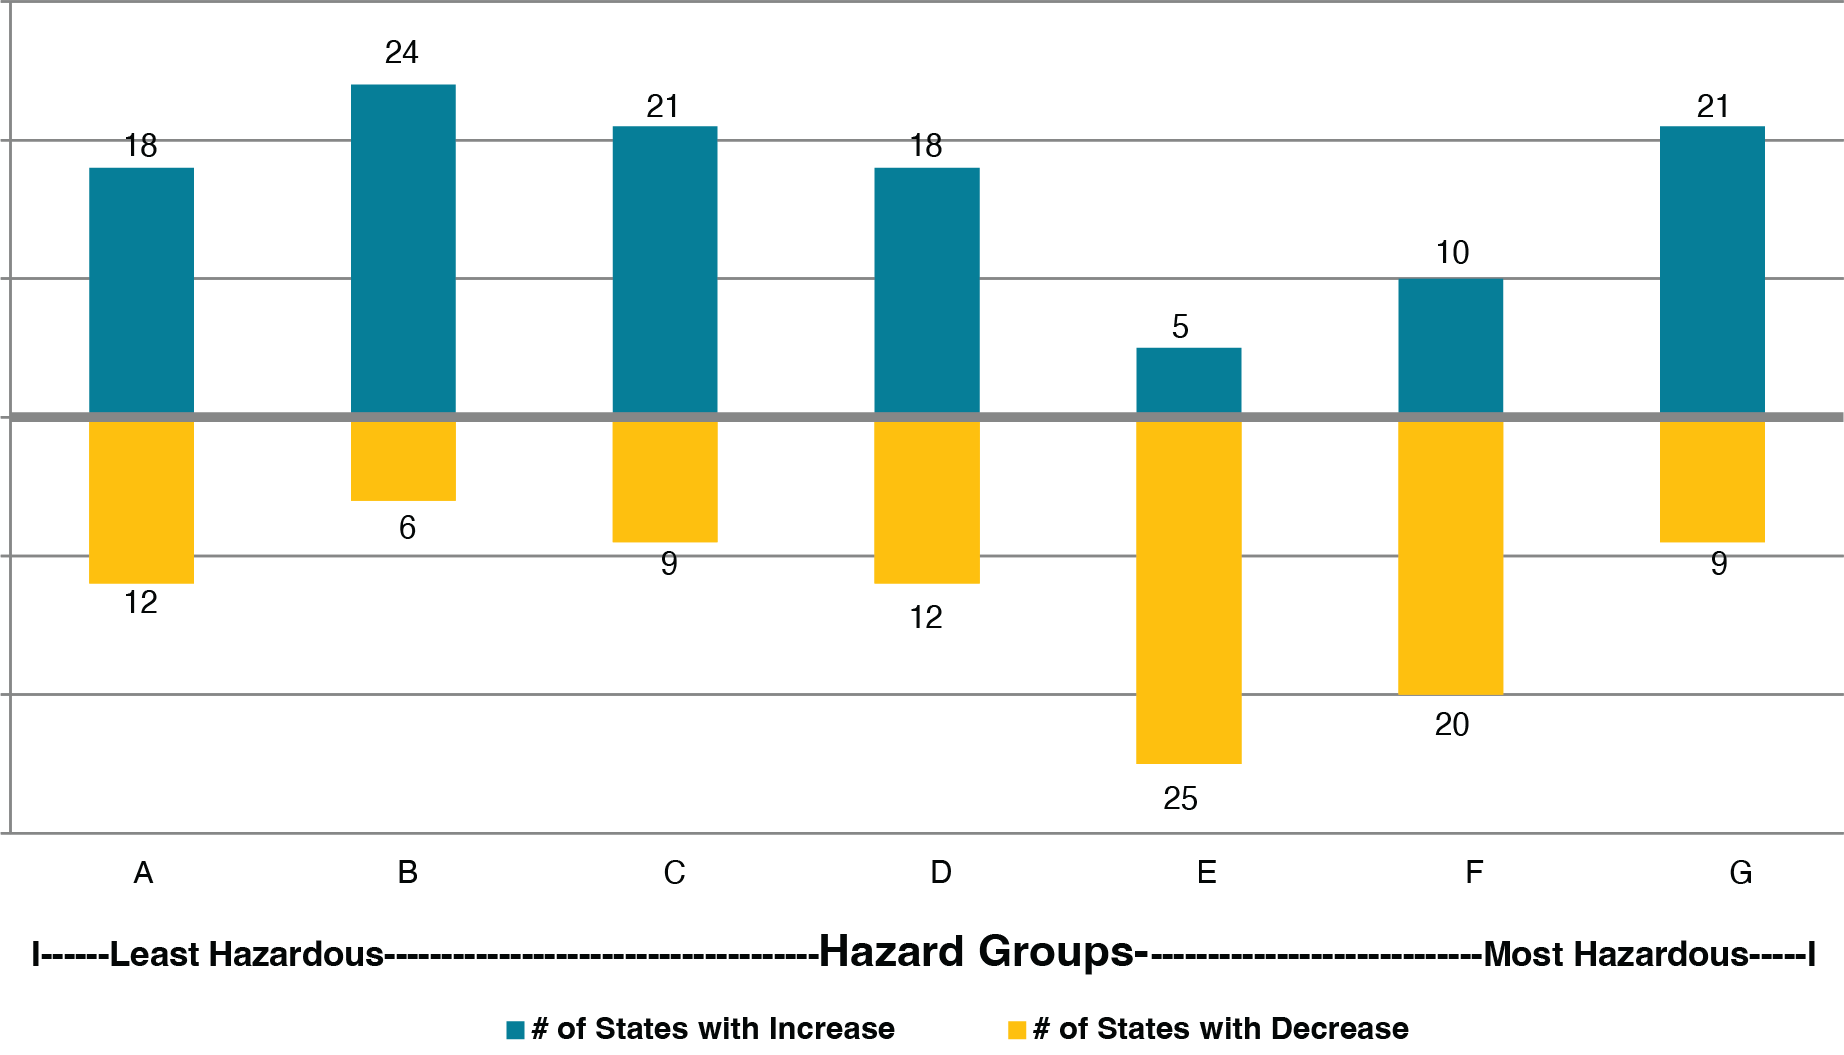
Although loss cost changes are not targeted by hazard group (HG), NCCI studied the impact of allocating expected excess losses greater than $500,000 by quantifying loss cost changes by HG across states.


A priori, one may anticipate that the numbers in Figure 13a would consistently increase from A to G because the excess ratio factors increase from A to G. However, the loss cost changes for HGs E and F were consistently negative across the states. This phenomenon, as illustrated on Figure 13b, happened because
-
The contractor classes dominate the volume within E and F, and
-
The high volume of not-likely-to-develop losses underlying class codes within HGs A-C, combined with the higher LDFs (compared to prior non-serious), provide strong upward pressure on loss costs
Because excess ratio factors vary significantly from HG A to G, NCCI computed the same relativity change as was done by industry group.
3.3. Class code results in the first year
Results for the top 25 class codes reflect the impact of the new methodology because these class codes were fully credible in many states. The loss cost change is driven by state data (i.e., the indicated pure premium) with little weight applied to the national pure premium. Table 2 shows average results achieved during the first filing season across the first 30 approved states.
These 25 class codes represent about 40% of all NCCI states’ premium. Note the prevalence of contracting group codes within hazard groups E and F experienced the most decreases. Two class codes in Goods & Services, retail stores and nursing homes, experienced mainly increases across the states. Because of the large excess factor for HG G, the roofing code experienced the largest average increase across the states.
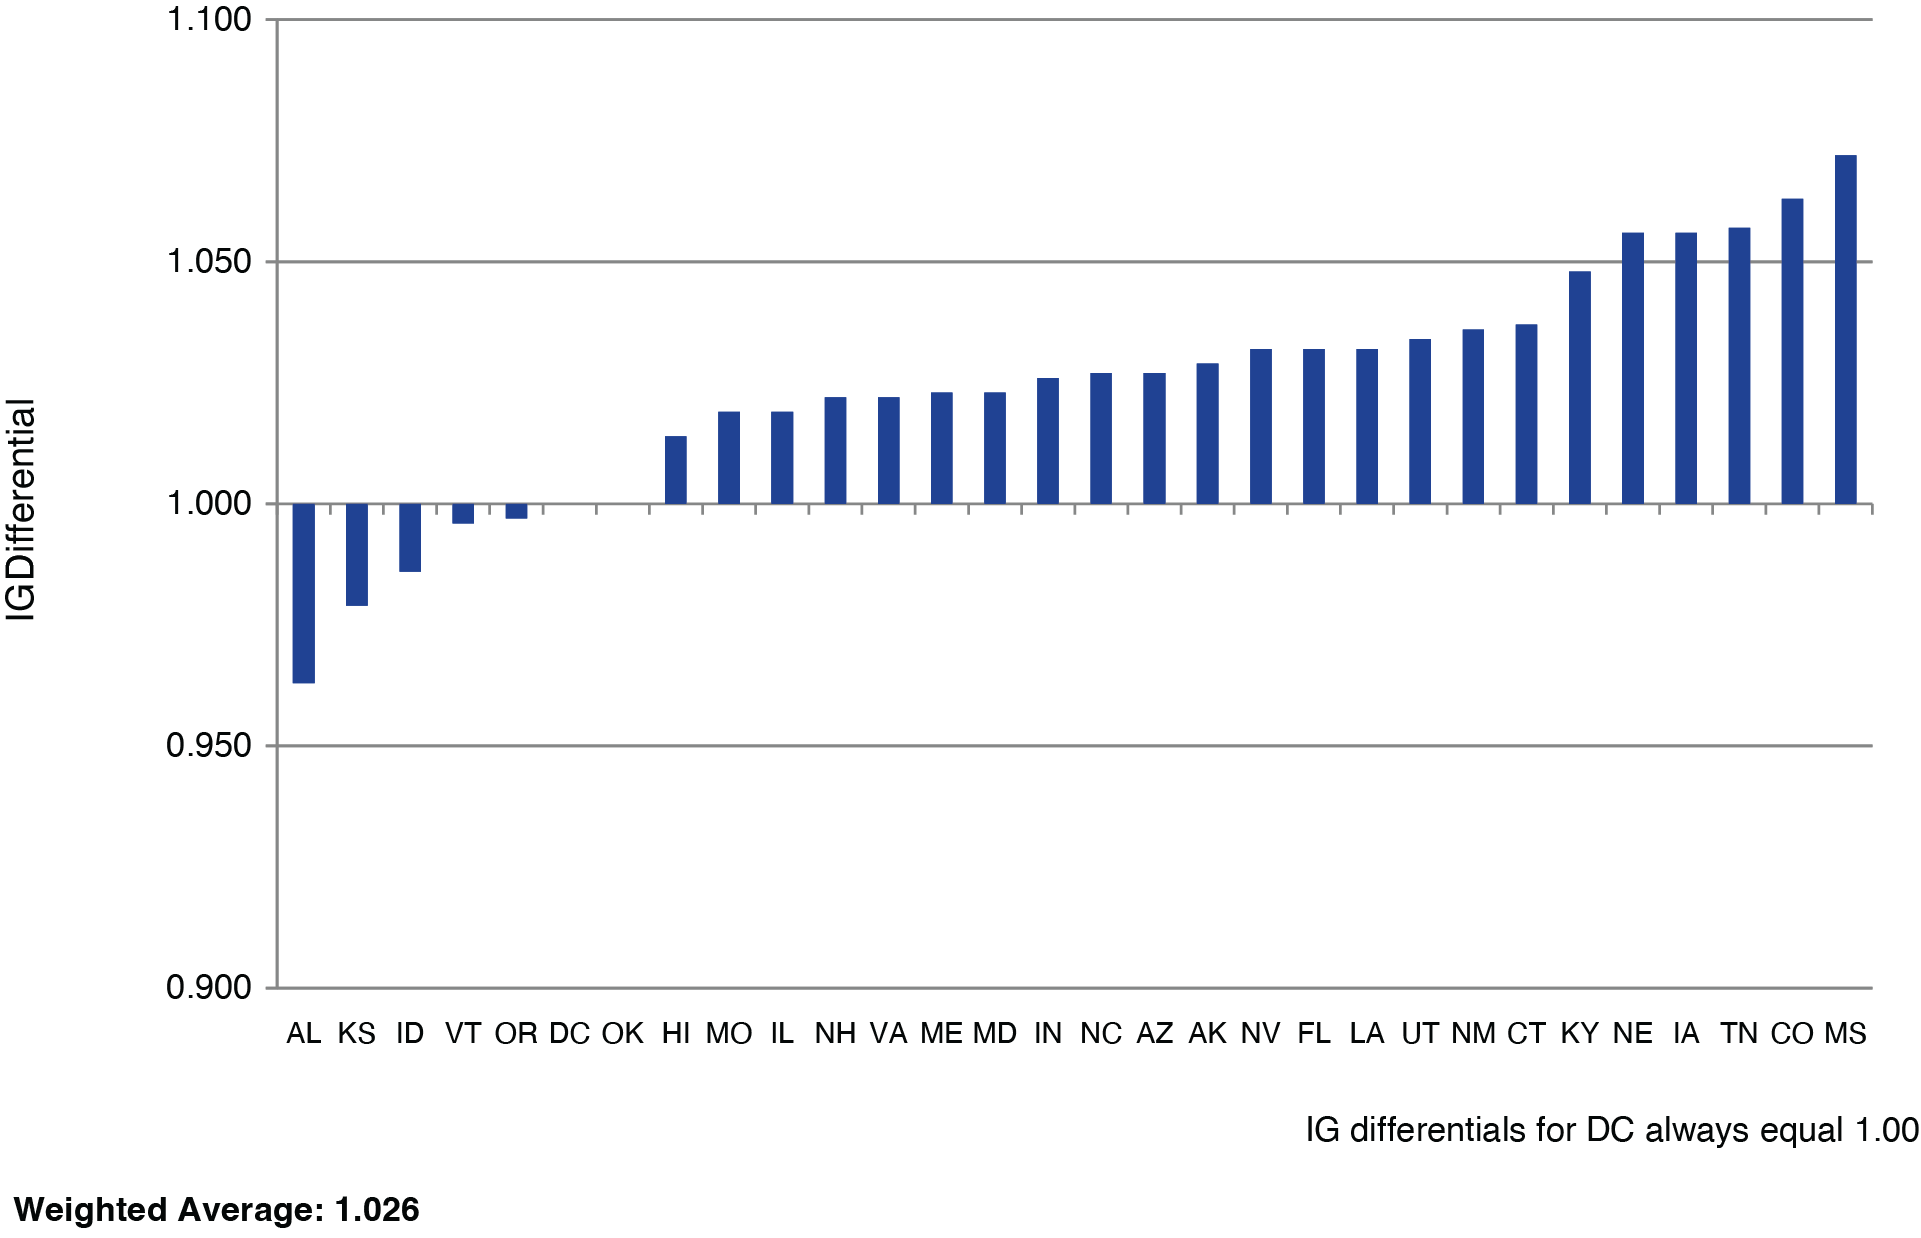
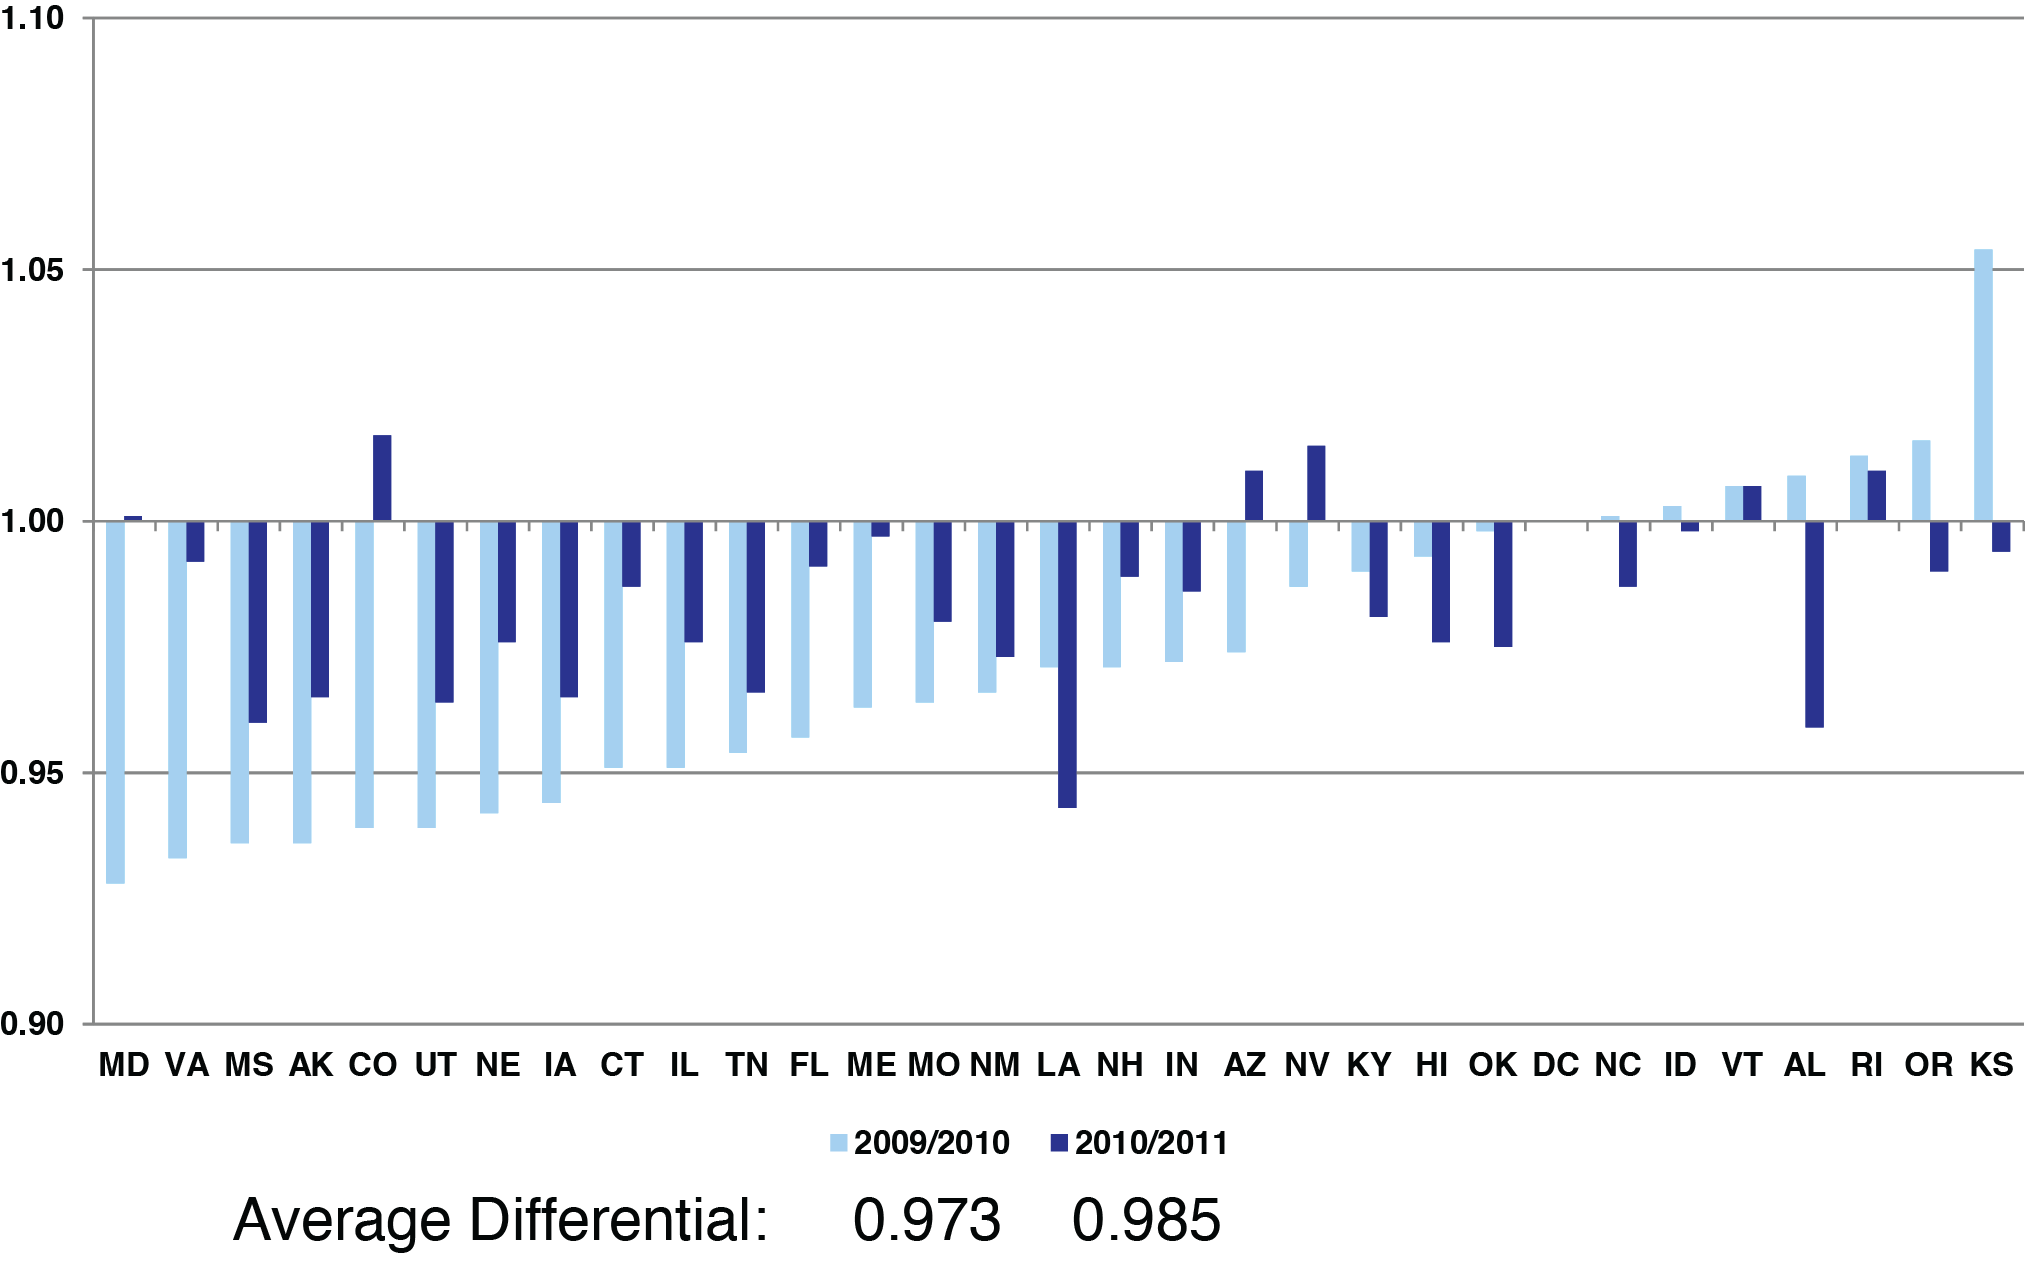
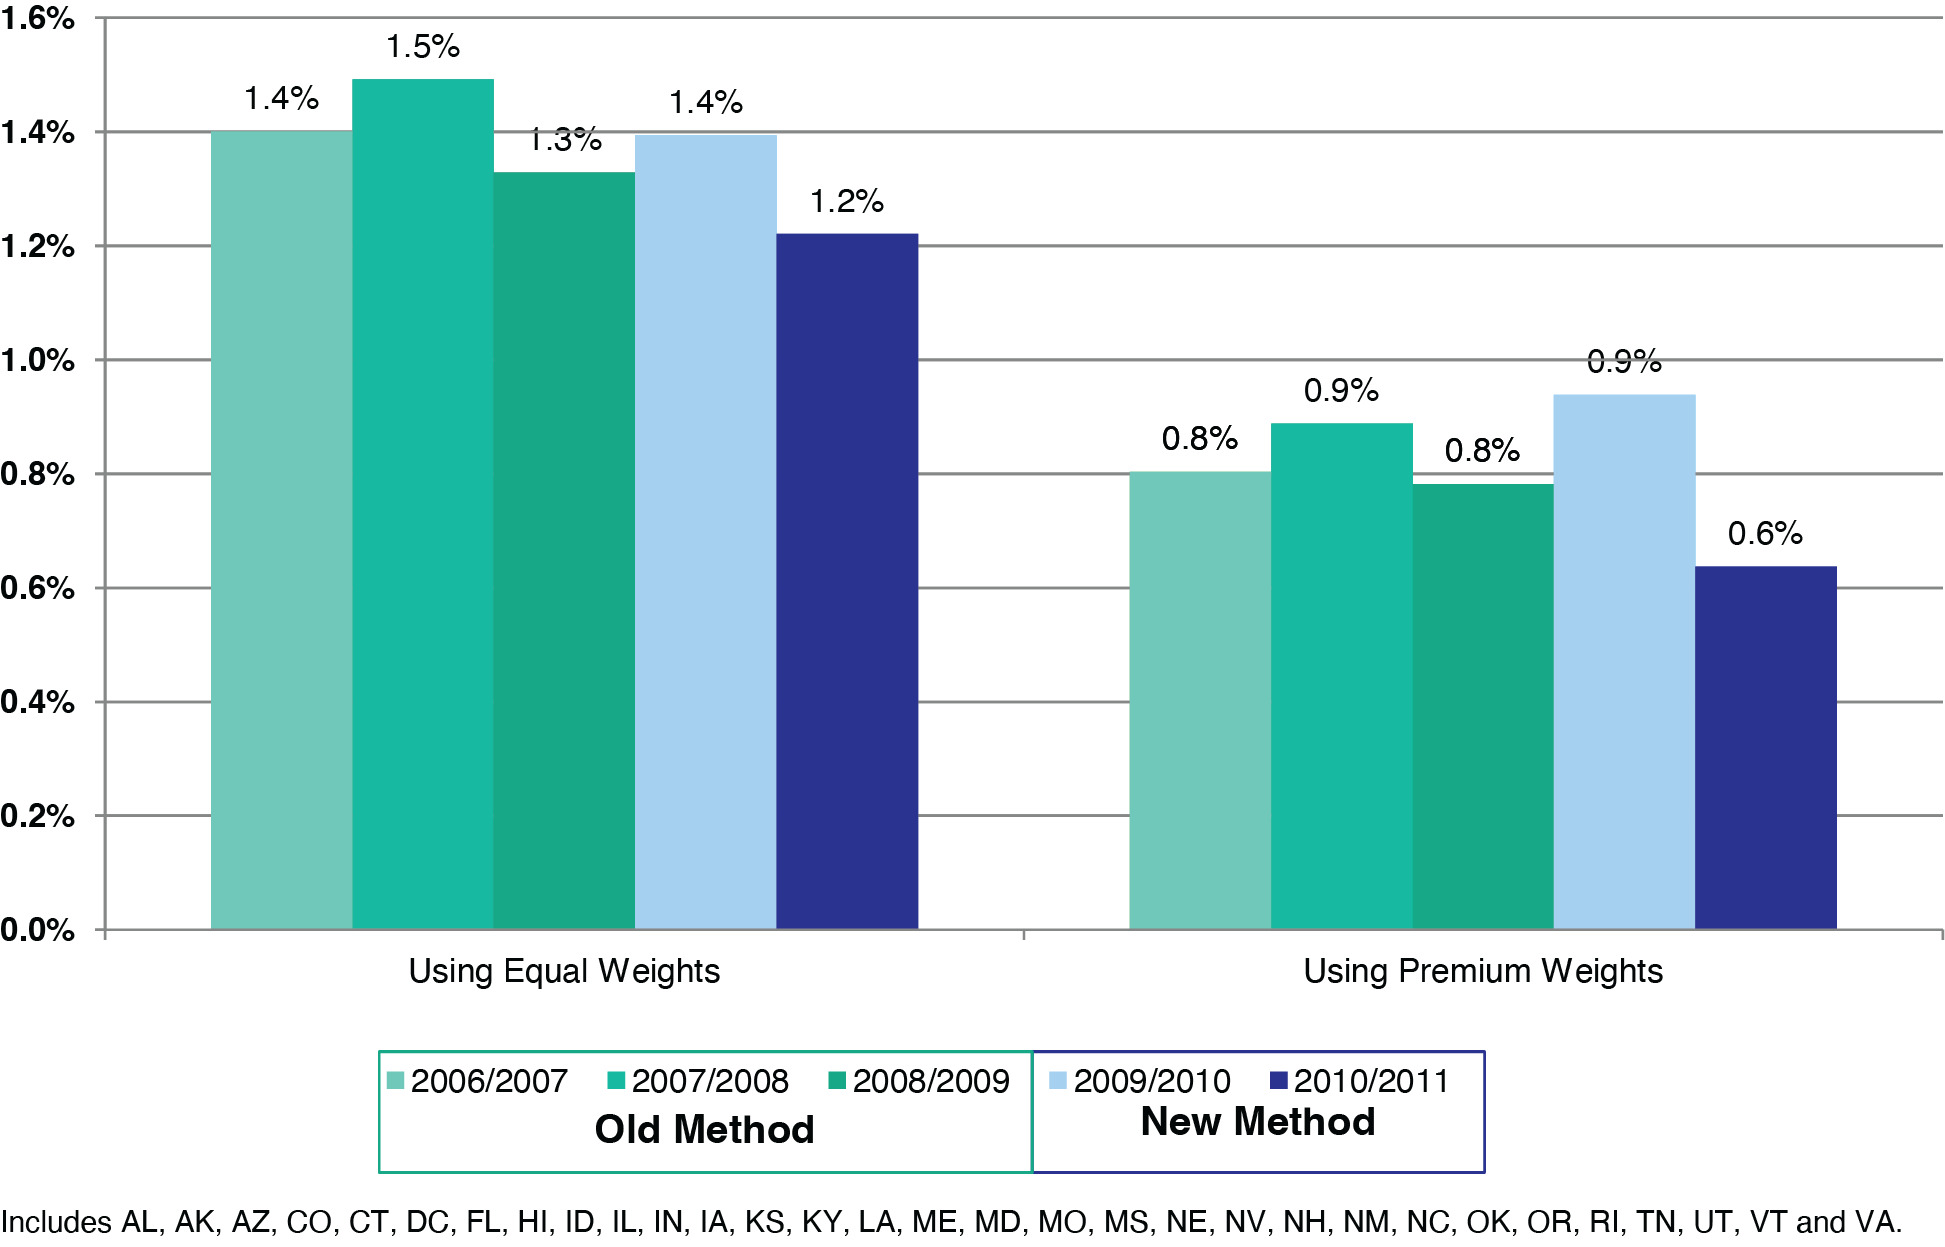
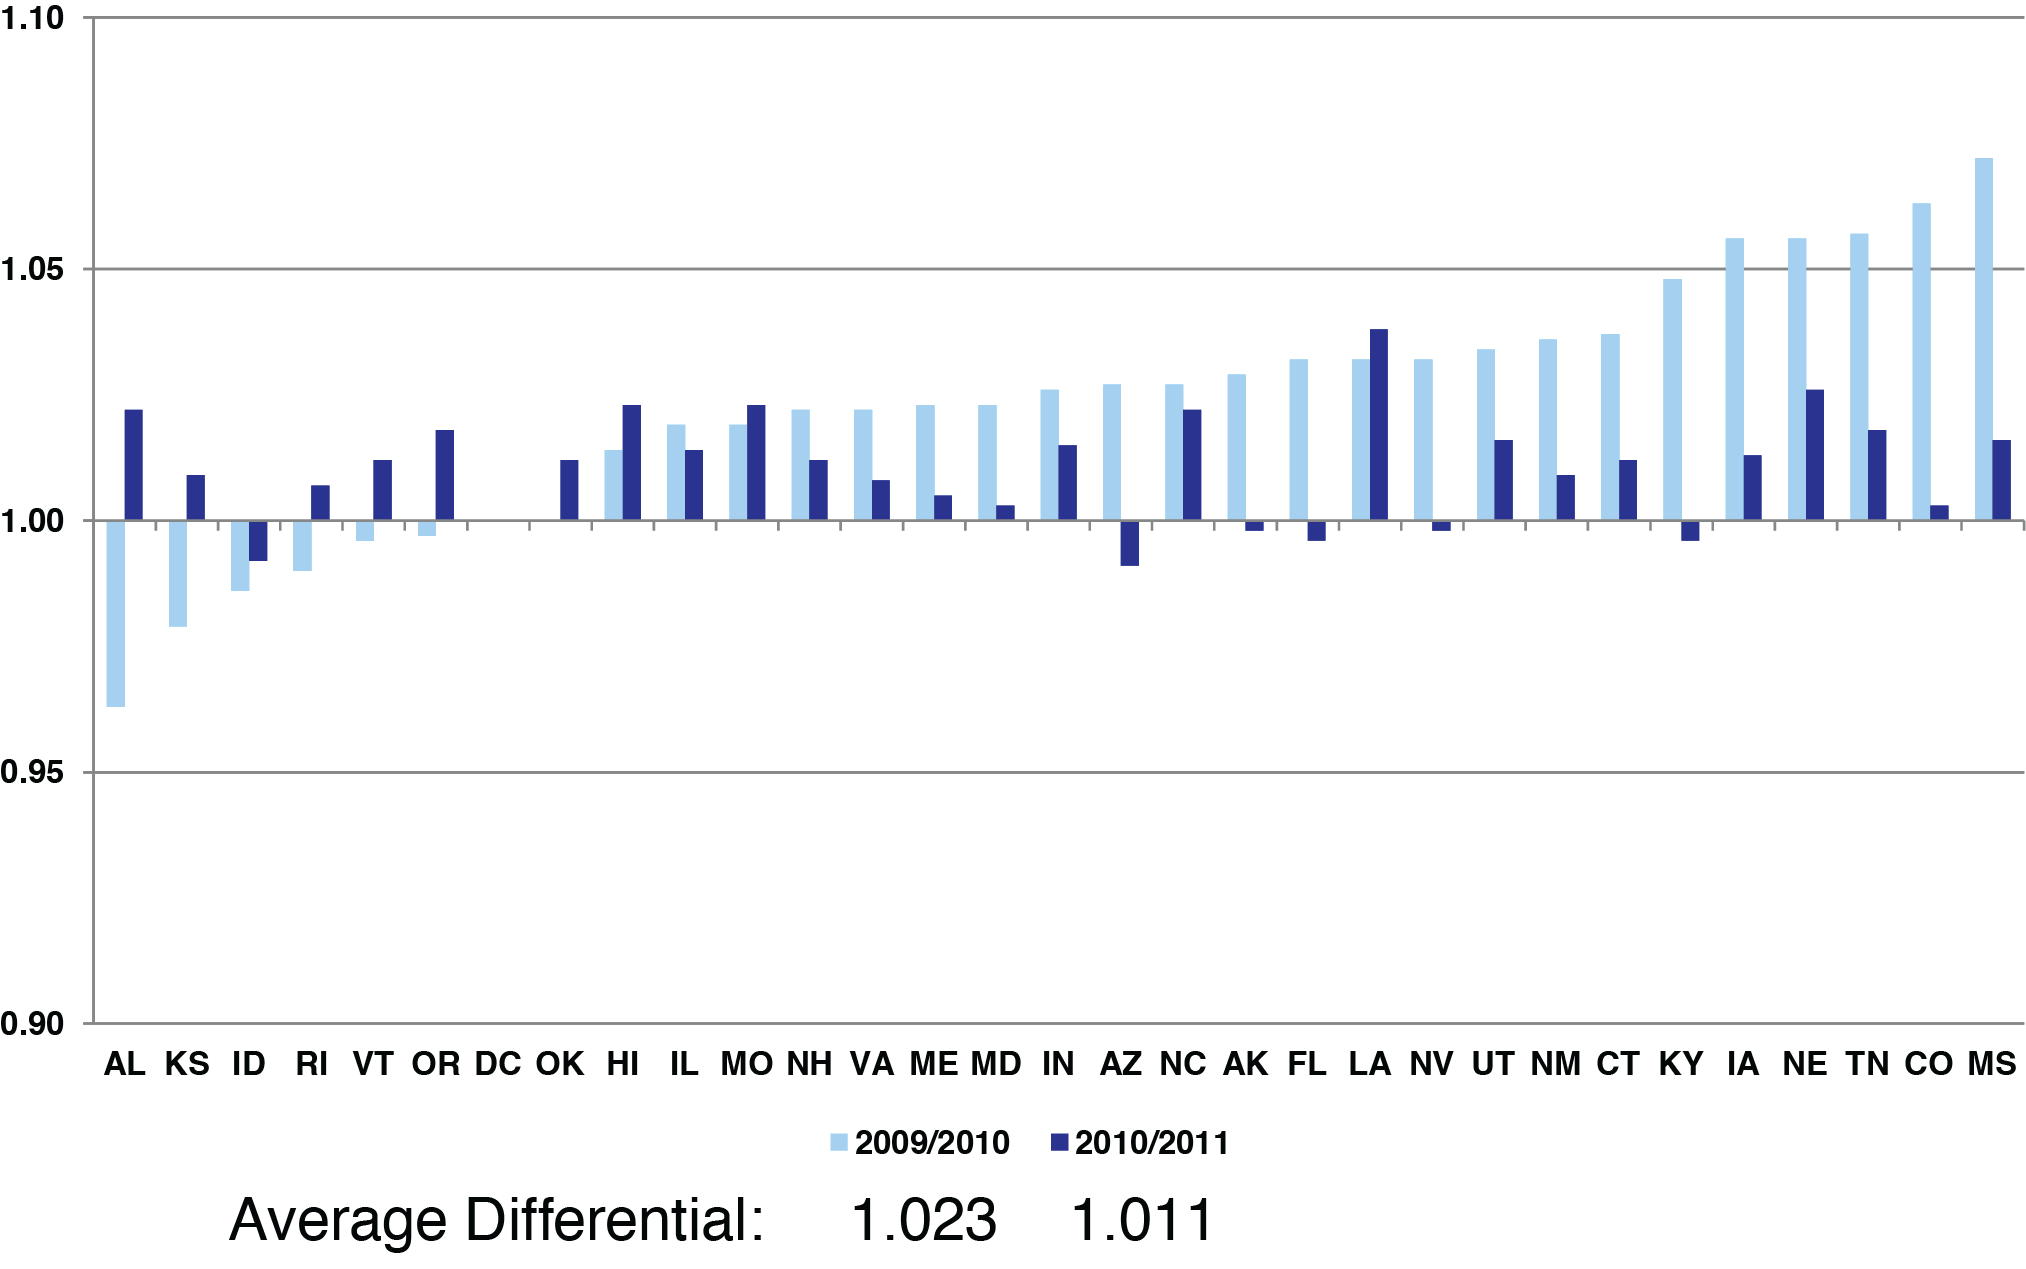
3.4. Stability results measured after the second year
In 2011, NCCI performed an analysis aimed at measuring the stability of the new methodology, after 31 state filings were approved in the second year. Figure 14 illustrates the results of the stability analysis for industry groups, while Figures 15a, b, and c are measurements of observed class code results.
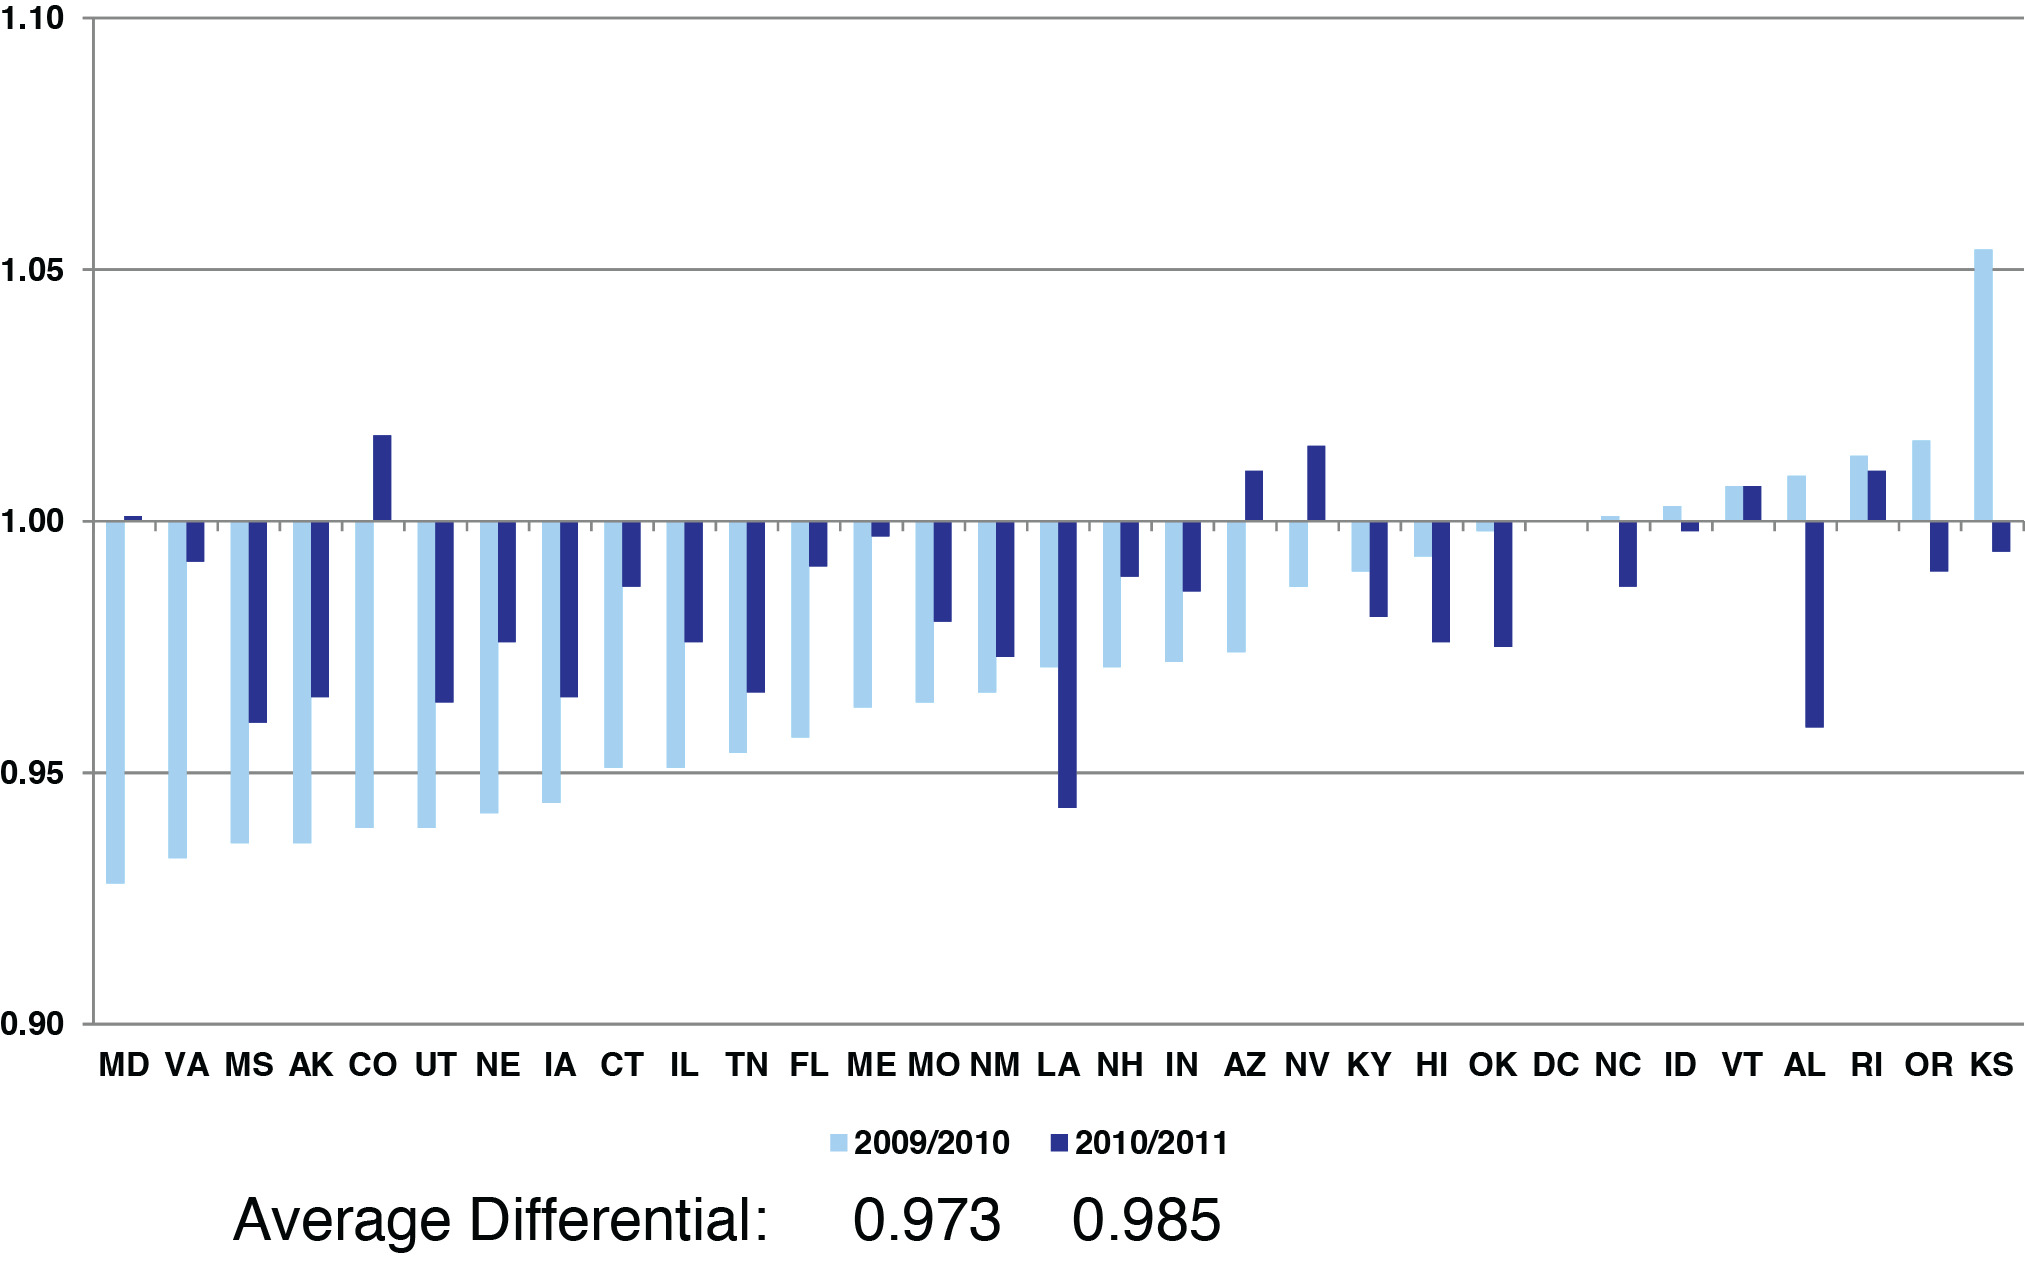


Under the new methodology, the IG differentials are more consistently within the range [.95, 1.05] because
-
The unlimited-to-limited ratio of the prior method was eliminated, and replaced with expected excess, and
-
An increase in the full credibility standard for the IG differential methodology provides more year-to-year stability in smaller states.
NCCI also created a metric measuring the variance of relative class code loss cost changes across the most recent five filing seasons across all 31 states. The metric is
where
Class Code j=the percentage change,Loss Cost Change i expressed as a factor, from one filing to the next for class code j in the ith state. For example, a−8.0% change=0.920;Overall Statewide=the average premiumChange i change across all classes within the loss cost filing for the ith state, also expressed as a factor; andNi=the number of class codes within the loss cost filing for the ith state.
4. Conclusions
This paper documents several important changes that were implemented in the class ratemaking process used to determine workers compensation loss costs and rates. Implementing large modifications to class ratemaking brings many positive enhancements, including more stability from year to year on a class code level. Long-term loss cost adequacy should also be improved by some of the innovations leveraged from the expected excess of the new seven HG mapping and the new loss development methodology. The use of new data elements such as injured body part helps invigorate the methodologies.
Most importantly, the changes support the long-term goals of loss cost/rate adequacy, and stability, and promote class ratemaking consistency across NCCI states.
Acknowledgments
The author acknowledges Jim Davis, the project leader, who helped present the results with me. The author acknowledges contributions by Pam Barlow and Chris Poteet for their innovative efforts on the body part loss development research; and excellent contributions by Nadege Bernard-Ahrendts, Angela McGhee, and Yair Bar-Chaim for the analysis of first-year and second-year results. I thank Damon Raben and Delano Brown for their critique of our research and implementing it, Dan Corro for the creative simulation work on excess, Yair Bar-Chaim for peer review, and Linda Magness for assistance with exhibits. Finally, we would like to thank the members of NCCI’s Actuarial Committee for their input.