

1. Introduction
Climate change poses one of the gravest risks to humanity in the 21st century (Reichstein et al. 2013). For insurance industries, the impact of natural catastrophes is increasingly important for managing and mitigating adverse claim experiences, and thus for solvency considerations. According to the Swiss Re Group, natural catastrophes caused total economic losses of US$190 billion in 2020, leading to US$89 billion in insurance payouts (Swiss Re Institute 2021). In 2022, the total economic losses from natural catastrophes rose to US$275 billion, resulting in US$125 billion in insurance payouts (Swiss Re Institute 2023), which is the fourth highest total for a single year.
Accurately predicting the severity of catastrophes remains a challenge that requires further scholarly attention and research. The catastrophe modeling literature includes classical research, such as Grossi (2005), Panjer and Willmot (1992), and Kozlowski and Mathewson (1995), as well as more recent publications, such as Reed et al. (2020), Vijayan et al. (2021), and Zanardo and Salinas (2022). Our research explored the potential of leveraging text data from news articles for predicting the duration of and losses from catastrophes. Natural language processing (NLP), an emerging field in artificial intelligence, provides the ability to automatically read, understand, and derive meaning from text data. A typical NLP process requires data scraping, sentimental analysis, text embedding, feature extraction, and topic modeling. While text-based analytics are a relatively recent development in insurance, they have proved to be useful in the social science, economics, and finance fields, as evidenced by the work of Cong, Liang, and Zhang (2019) and Hanley and Hoberg (2019), along with comprehensive survey papers by Gentzkow, Kelly, and Taddy (2019) and Grimmer and Stewart (2013).
Our research proposes a natural language learning-based approach to catastrophe duration and loss prediction, and is among the first of its kind in actuarial research. Our primary objective was to gain new insights on how information from online news articles can be used to help achieve a timely estimation of catastrophe duration and insurable economic loss. Applying the proposed approach, we investigated the following questions:
-
Can online news provide an early warning of extreme catastrophe events?
-
What words (or topics) are the most significant indicators of catastrophe severity?
Answers to these questions are of particular value to insurance and reinsurance companies with large exposure in catastrophe risk. The paper is organized as follows: Section 2 introduces the proposed NLP-based approach. Section 3 describes the catastrophe data used in this research. Section 4 presents empirical results based on wildfire and hurricane case studies. Section 5 concludes the paper.
The news text information used in our model is not only readily obtainable but also allows swift identification of disaster risks and early-stage loss predictions during catastrophic events. The results indicate that machine learning tools exhibit high efficiency and accuracy in predicting disaster losses, which will facilitate early warnings and timely decision-making. These findings hold substantial implications for the insurance industry.
2. Methodology
2.1. A quick introduction to NLP
Natural language is a crucial component of human society and represents the most fundamental aspect of modern data sources. With advances in machine learning algorithms and computer languages, it is now possible to analyze large collections of unstructured machine-readable texts (corpora).
First, statistical features can be extracted using n-grams (Cavnar and Trenkle 1994) and skip-grams (Cheng, Greaves, and Warren 2006). These features are usually organized in a term frequency, inverse document frequency (TF-IDF) matrix. The information is then represented using frequency measures. Second, NLP can efficiently extract news semantics from a given corpus. Semantic features can be extracted via Word2Vec (Mikolov et al. 2013) and BERT (Devlin et al. 2018) methods, based on a neural network model that learns word associations from a large corpus of text. This process allows us to represent text information in terms of both statistical features and semantic features.
2.2. Overview of the approach
Stage 1: Daily news source for catastrophe events. We identified and collected relevant news from news aggregator websites such as Google by searching with a combination of location and catastrophe keywords, restricting the search time to the calendar month in which the catastrophe occurred. News aggregator sites generally aggregate headlines from trusted news sources worldwide, group similar catastrophe events together, and display them according to certain patterns.
Stage 2: Full text scraping. For each news headline displayed in Google, we built a web crawler to extract its news contents using the Python programming language, allowing us to retrieve the news title, news source, published time, and full contents. The crawler was deployed onto a server so that it executed the scraping task periodically. This ensured that we obtained the news in a consecutive manner. News was cleaned so that only catastrophe event-related contents were retained. See Section 3 for more details about text data scraping.
Stage 3: NLP steps. We employed standard NLP algorithms to extract features from scraped news, then calculated and computed two types of numerical features, statistical and semantic. Statistical features, including word frequency and catastrophe loss information (such as event location, time of occurrence, type of loss, and amount of loss) were computed by the TF-IDF method. Semantic features were associated with a lexical item from the catastrophe news, and extracted via Word2Vec and BERT methods.
Stage 4: Catastrophe duration and loss prediction. To detect early warnings of severe catastrophe events, we employed anomaly detection tools for a given variable of interest from statistical features. We extracted disaster-related words from existing textual information to construct a disaster lexicon, and matched disaster duration and loss data with the content extracted from the textual information. By converting textual content into vectors, we could construct classification and regression models to predict future disaster severity.
Based on the computed news features and the corresponding catastrophe data, we employed the RandomForest (Breiman 2001), LightGBM[1] (Ke et al. 2017), and XGBoost (Chen and Guestrin 2016) algorithms to determine the relationship between news features and catastrophe duration and losses. Moreover, the relationship between the number of news items, number of news topics, and the size of loss could also be studied along with the news meta information. The proposed modeling framework is illustrated in Figure 1.

3. Data
The project’s empirical study analyzed U.S. wildfire and hurricane data from 2020, and the text data for analyzing catastrophe loss was crawled from Google. We converted the textual data into numerical variables to facilitate our modeling and prediction strategies. We first combined location and catastrophe keywords as search phrases for each catastrophe and restricted the search time to the calendar month in which the catastrophe occurred. We then used Python’s scraping module request to construct a URL object that requested resources from the server and parsed the HTMLs using BeautifulSoup. The result was 62 pieces of data for the wildfires and 207 pieces of data for the hurricanes. The searched results were saved as machine-readable CSV files. News meta information, such as title, source, and time, were saved to identify the comprehensiveness of the news. For the data preprocessing step, we cleaned invalid information or abnormal text by assigning regular expressions and matched the crawled news content with the corresponding U.S. catastrophe duration/loss data.
Our primary data source for catastrophe duration and loss in the U.S. was the Spatial Hazard Events and Losses Database (SHELDUS). This database is maintained by Arizona State University and is commonly used by the actuarial community. It provides detailed catalogs of all major catastrophes in the U.S., such as droughts, earthquakes, floods, hurricanes, thunderstorms, tornadoes, and wildfires. Available information includes event location and duration, time of occurrence, type of loss, and amount of loss. We collected catastrophe duration and loss data at the county level for the same time period as the scraped news. See Table 1 for a detailed variable description.
4. Empirical studies
We considered two types of natural catastrophes, wildfires and hurricanes, and predicted and evaluated the losses of each catastrophe-affected county using machine learning models such as Random Forest, XGBoost, and LightGBM. Each type of natural catastrophe has unique characteristics, influences, and indicators used to measure severity. For wildfires and hurricanes, we selected duration days and loss amounts, respectively, to measure event severity. We compared the performance of various machine learning models to identify the most suitable model for a specific type of natural catastrophe, and to develop a general model that can be applied across multiple types of catastrophes.
4.1. Premodeling preparation
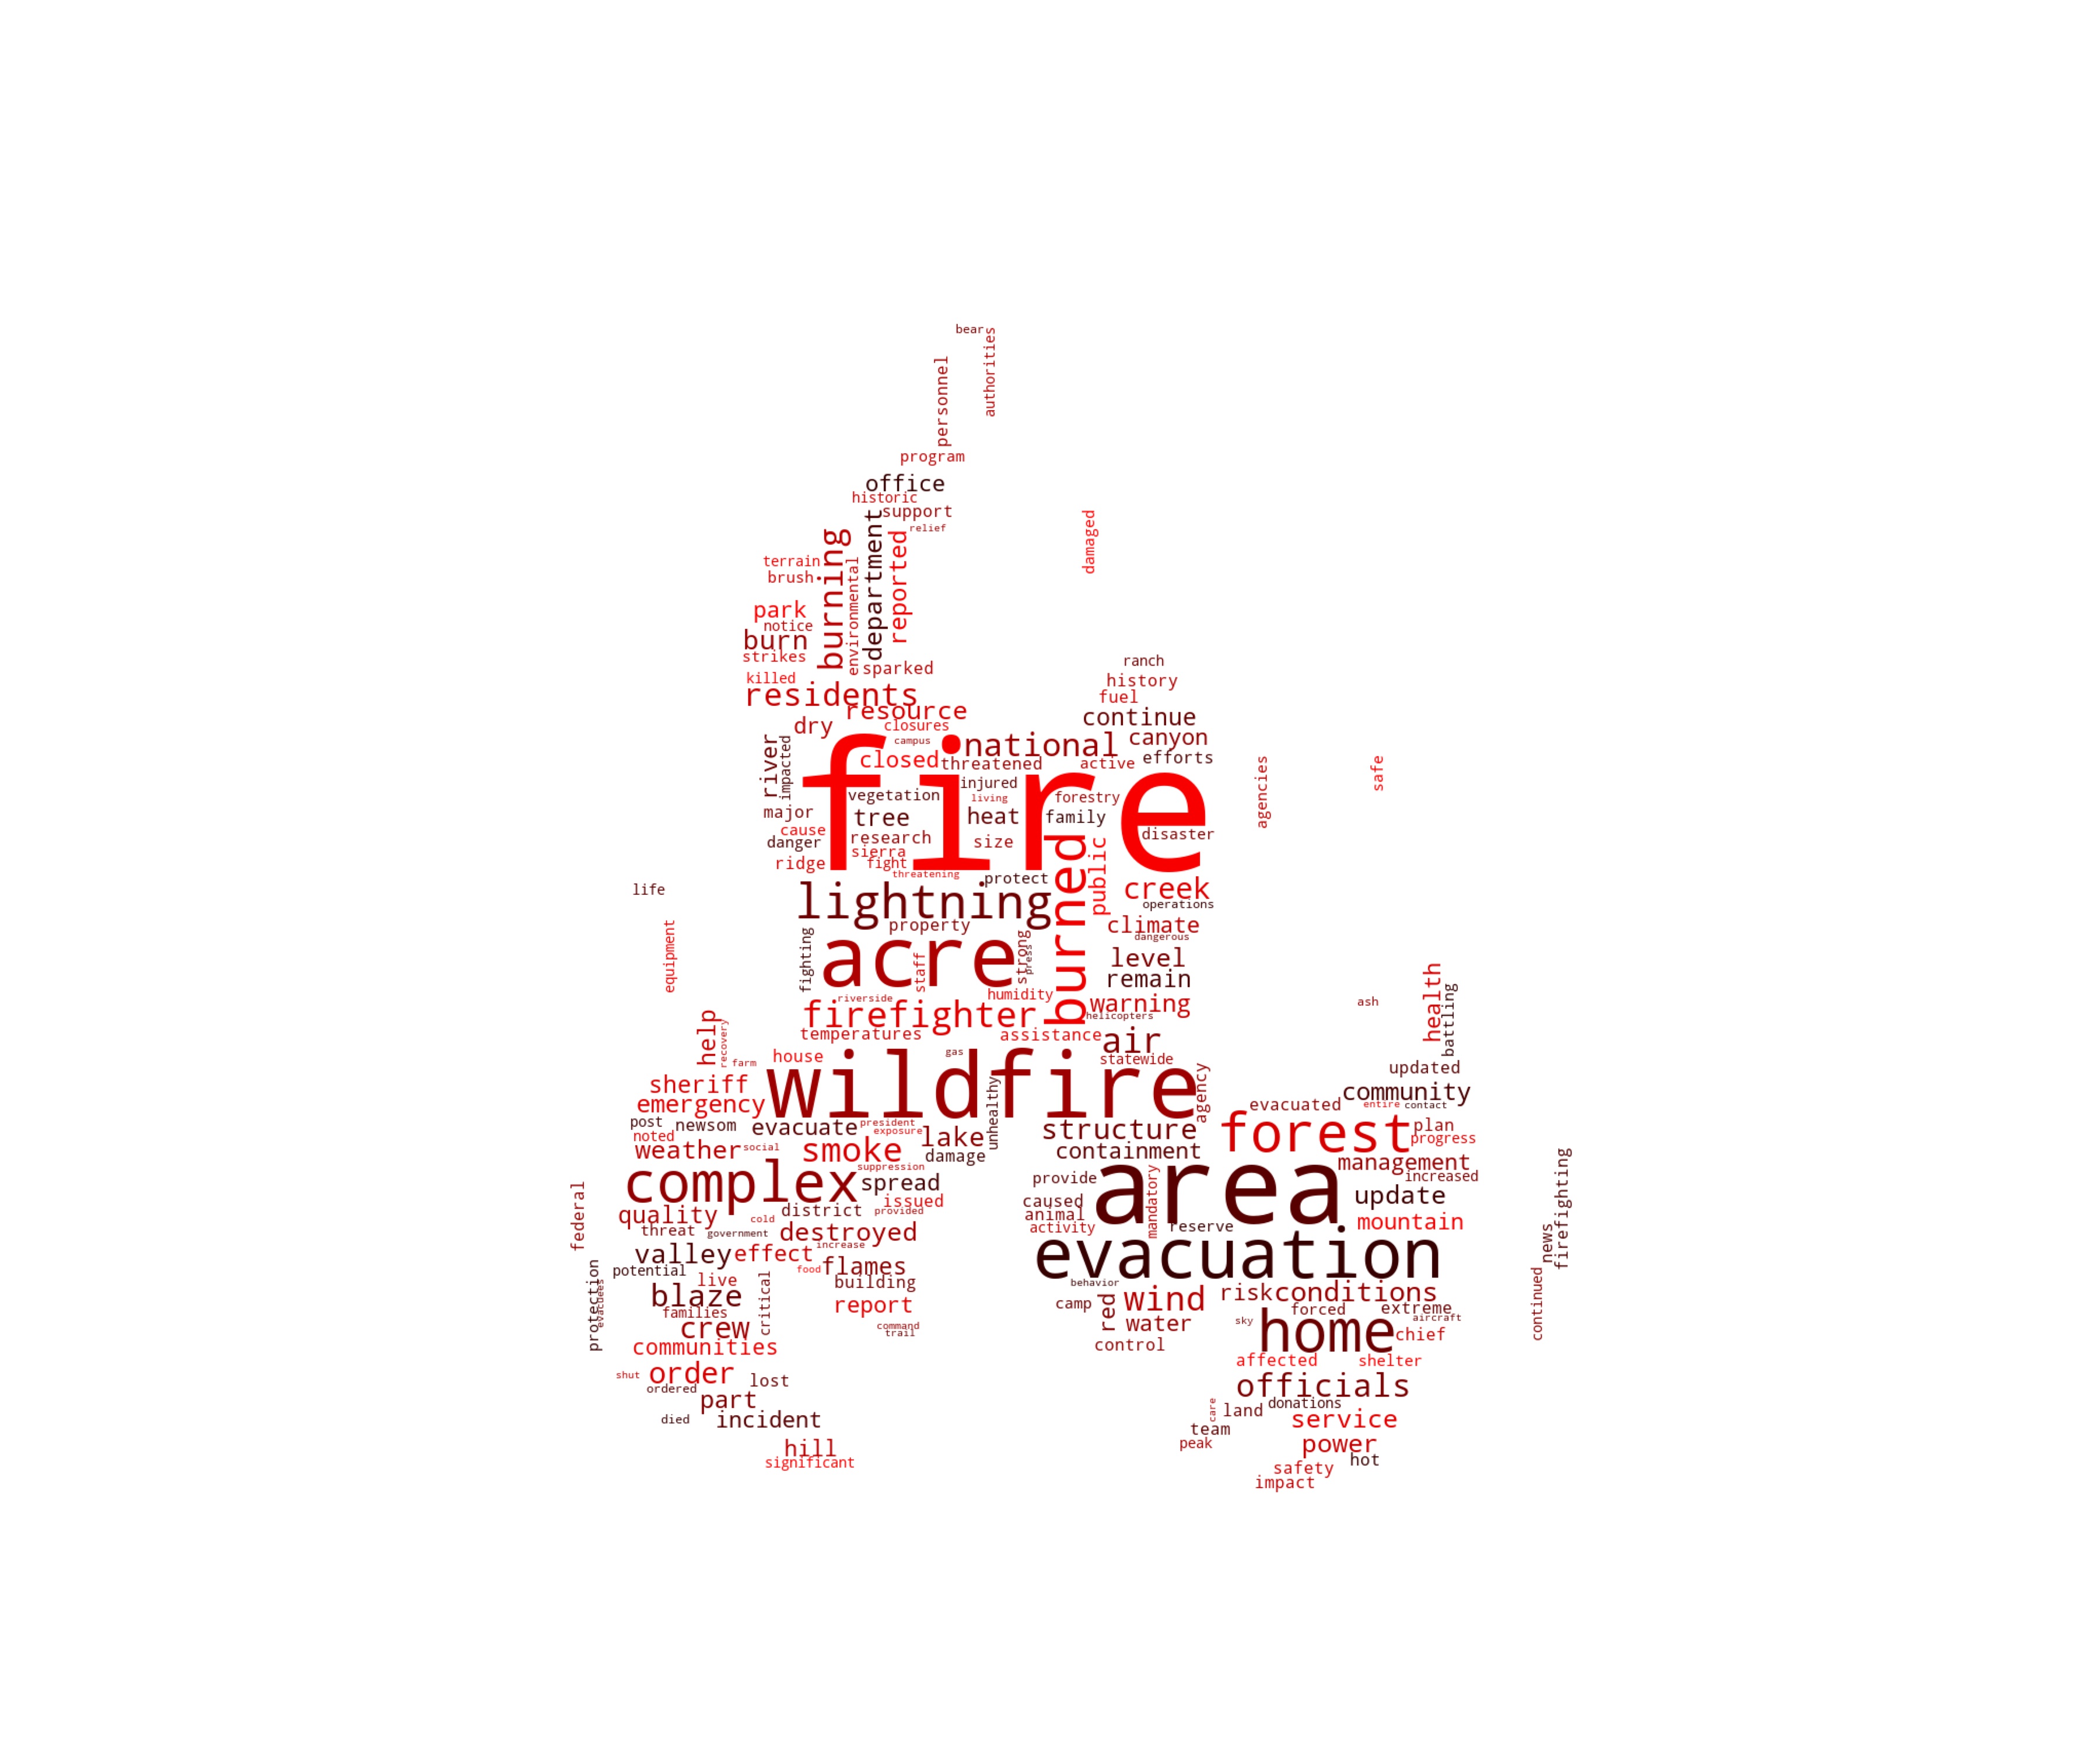
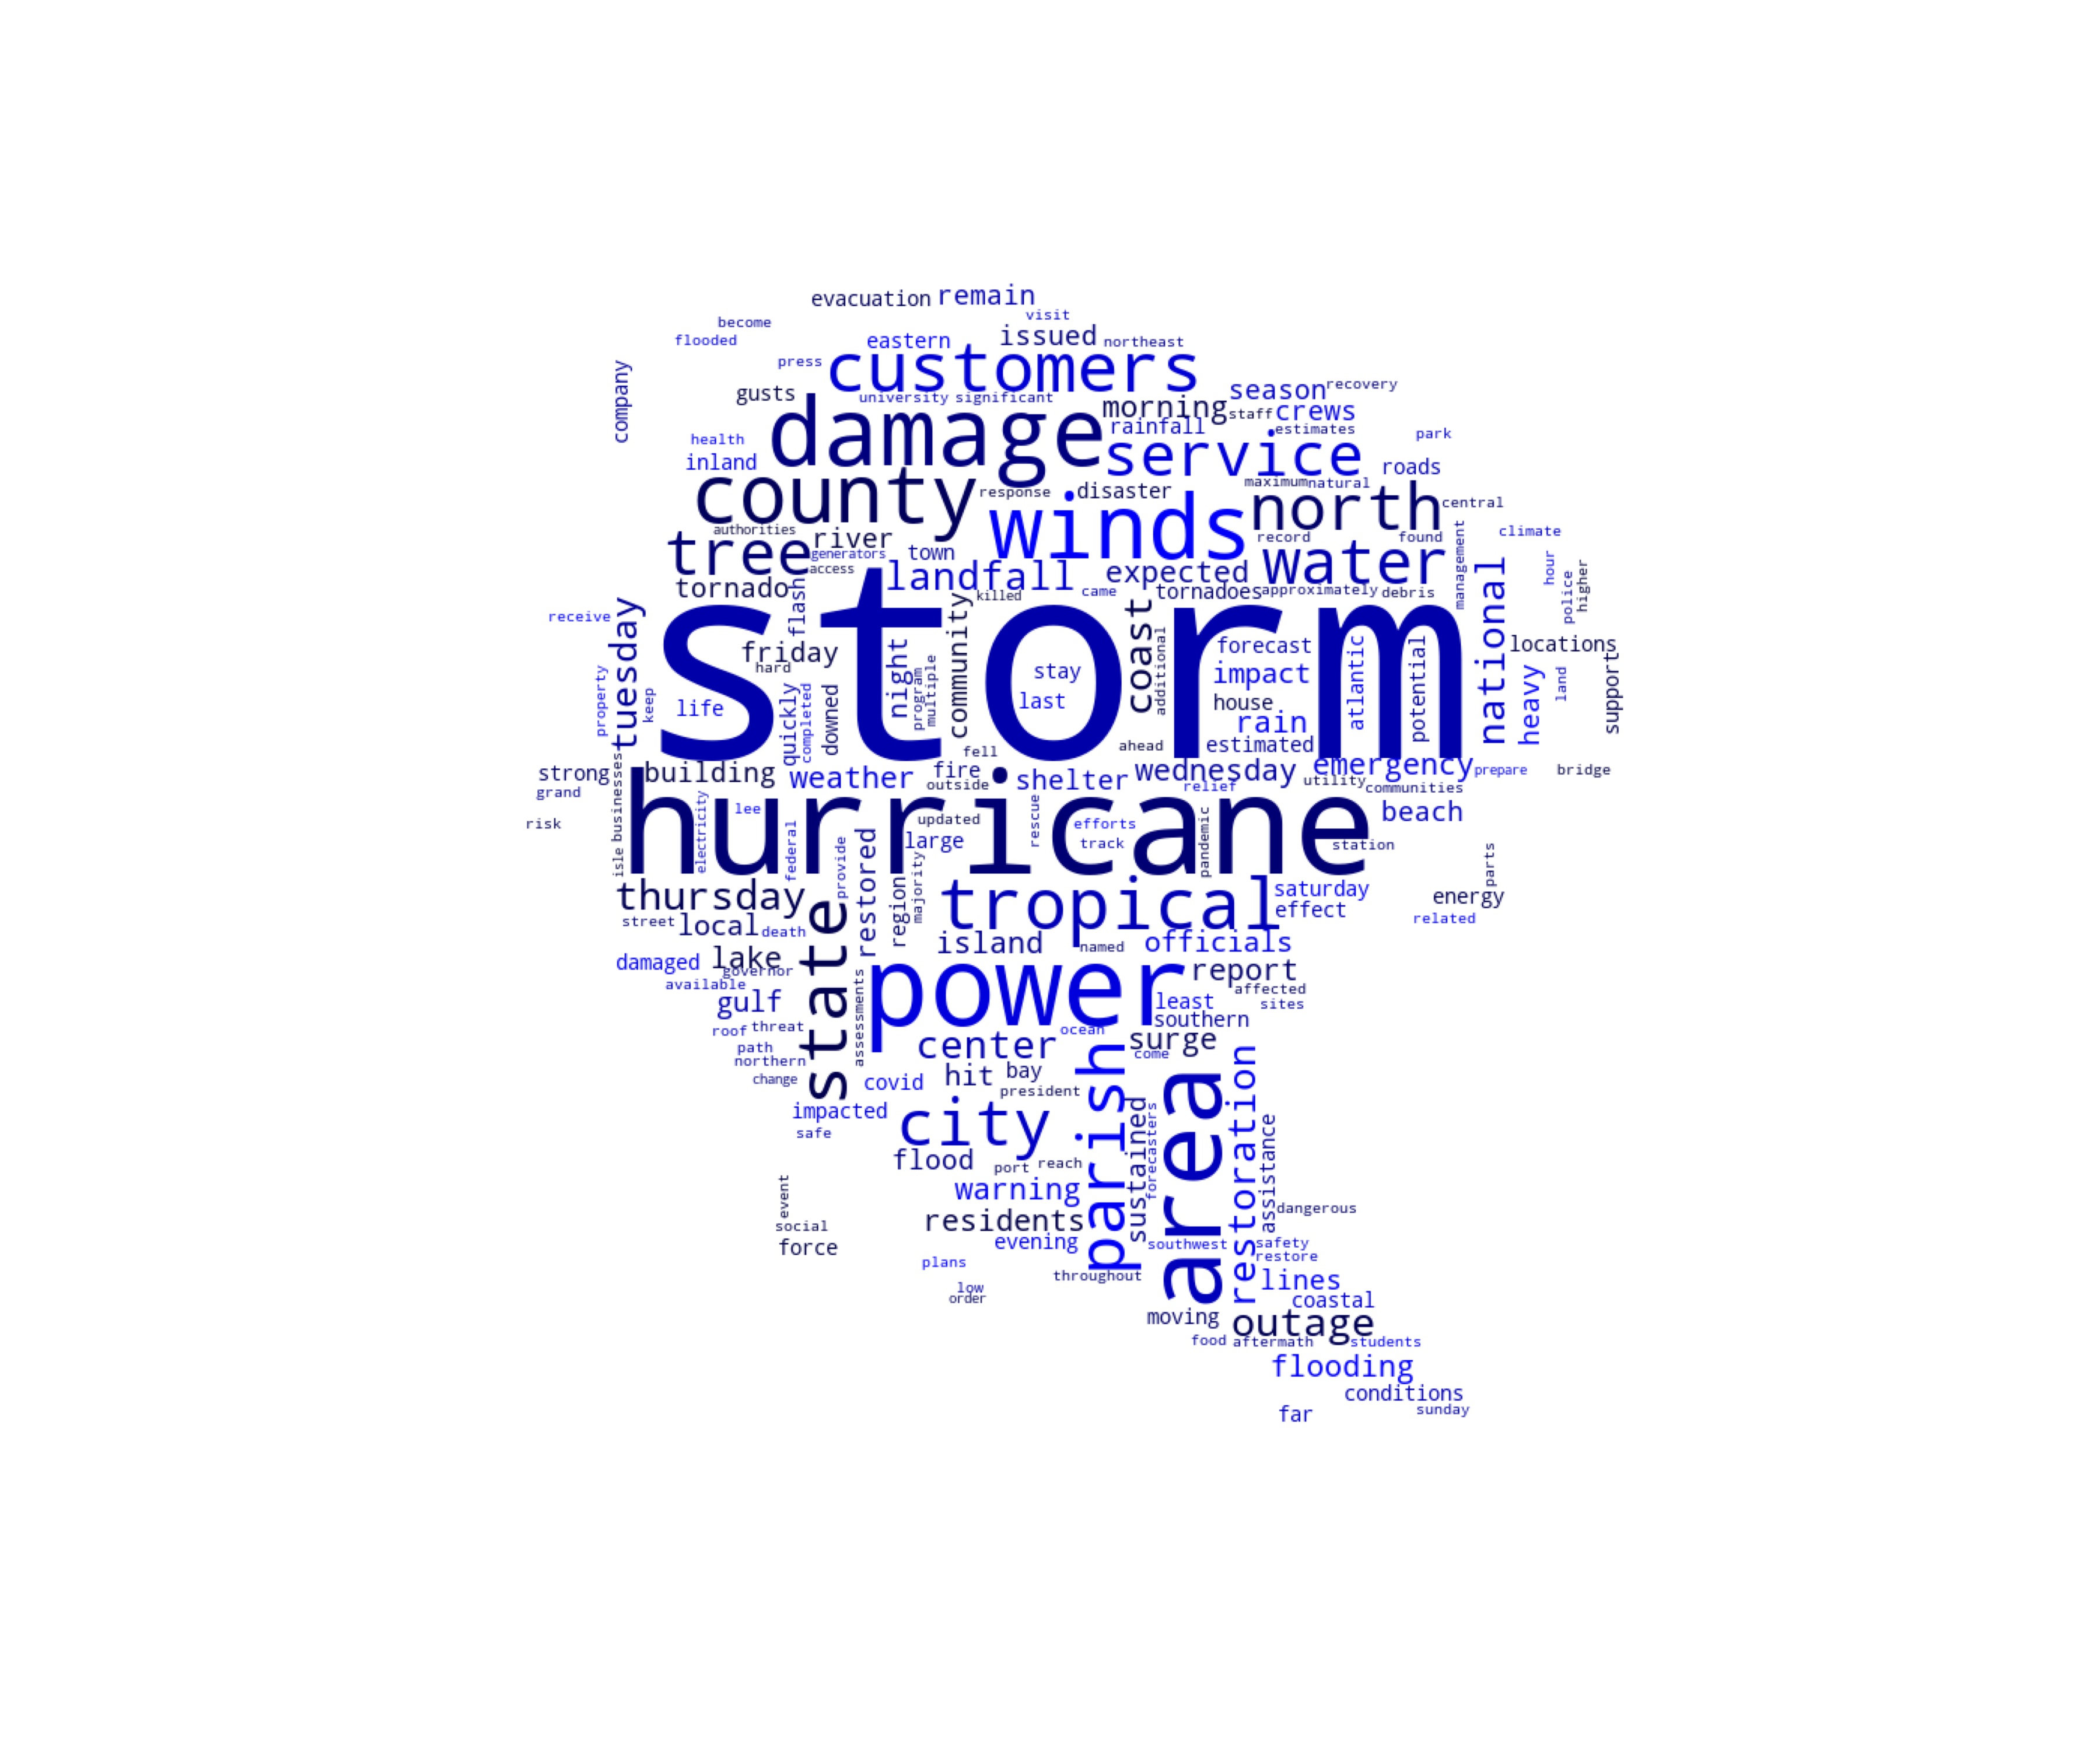
For the wildfire and hurricane data, we used Word2Vec and BERT to construct the document vectors. We first cleaned the text using regular expressions, and then used Python’s NLTK library for English word separation. We expanded the deactivated lexicon in the NLTK library to make the separation method more applicable to catastrophe data. The wildfire and hurricane datasets yielded 24,306 and 24,023 words, respectively. We selected 300 words as the keyword database, based on words that described the specifics and severity of the events and their frequency of occurrence, then we divided the words into categories according to their meaning. Environment describes the surrounding conditions, Actions describes the rescue activities, and Wildfire and Hurricane describe the event itself. The cloud maps for these words are shown in Figure 2 and Figure 3. Some of the keywords and their corresponding frequencies are shown in Table 2 and Table 3.


The word vector was obtained using a Word2Vec training model, where the frequency of each keyword was used as the weight. The weighted Word2Vec word vector was obtained by multiplying the word vector and the corresponding weight. The weighted word vector was accumulated to obtain the weighted text vectorized representation. Each text is represented by a 128-dimensional vector, as expressed in the Equation 4.1:
yi=j=300∑j=1wijxj,
where denotes the vectorized representation of each document, for denotes the vectorized representation of each word for and denotes the frequency of each word occurring in each document.
The word vector trained by the Word2Vec model is static, which means that the same word represents the same expression in different contexts. A BERT model, which can reflect the expression of sentence semantics in different contexts, offers a better solution. We used the pretrained BERT-base, multilingual cased model published by Google, which has 12 coding layers and can output 768-dimensional word vectors. For the hurricane data, we only trained the model using BERT.
4.2. Catastrophe index and accuracy measurement
Wildfires can cause significant damage, and their severity is often determined by the duration of their combustion. Therefore, we used Duration Days as the severity index for wildfires. Since Duration Days is a continuous positive variable, we employed a regression model. The duration of a hurricane event may not effectively reflect its severity, so we used the total amount of crop and property loss as the hurricane catastrophe index. We added Crop Damage and Property Damage to get Total Damage, the loss index for the hurricane data. However, there were large differences in total damage for different catastrophe events, such as 1 million dollars, 10 million dollars, or even 1 billion dollars of losses, spanning several orders of magnitude. For this analysis, we set two threshold values arbitrarily and divided Total Damage into three grades: less serious, serious, and very serious. We then used this as a new label loss index and converted the hurricane loss forecast into a classification model.
For evaluation indicators, we selected root mean square error (RMSE) and mean absolute percentage error (MAPE). It should be noted that RMSE measures the deviation between the predicted and true values and is more sensitive to outliers in the data. It is calculated as follows:
RMSE=√1nn∑i=1(yi−^yi),
where is the true value, is the forecasting value and is the number of samples. Unlike RMSE, which has the same unit as the forecast variable, MAPE is unit less and can be used to compare different datasets using the following formula:
MAPE=1nn∑i=1|yi−^yiyi|.
In addition, we used a triple classified confusion matrix, as shown in Table 4, where R0, R1, R2 represent the actual labels, 0, 1, 2, respectively, and P0, P1, P2 represent the predicted labels 0, 1, 2, respectively. The confusion matrix interpretation is as follows: denotes the total number of samples in the test set, and denote the number of samples for each of the true labels, and and denote the number of samples for each of the predicted labels, respectively. Among them, the number of samples that will be correctly predicted to class is and the number of samples of class incorrectly predicted to class is We selected Accuracy, Precision, Recall, and F1 score as evaluation indicators to compare the prediction effects of each model (see Equation 4.4–4.7).
Accuracy=T00+T11+T22N
Precision=TiiEi(i=0,1,2)
Recall=TiiTi(i=0,1,2)
F1−score=2×Precision×RecallPrecision+Recall
It should be clarified that the main objective of the research was to demonstrate the potential of NLP as a more timely method than classic loss prediction models for catastrophe loss prediction, but it may not necessarily have higher predictive accuracy. We acknowledge that if we had perfect information on geographic data, building characteristics, climate data, socioeconomic data, and policyholder data, classic loss prediction models might work better than the NLP methods we proposed. However, perfect data are unlikely to be the case in practice. This highlights another advantage of the NLP method.
4.3. Wildfire duration prediction
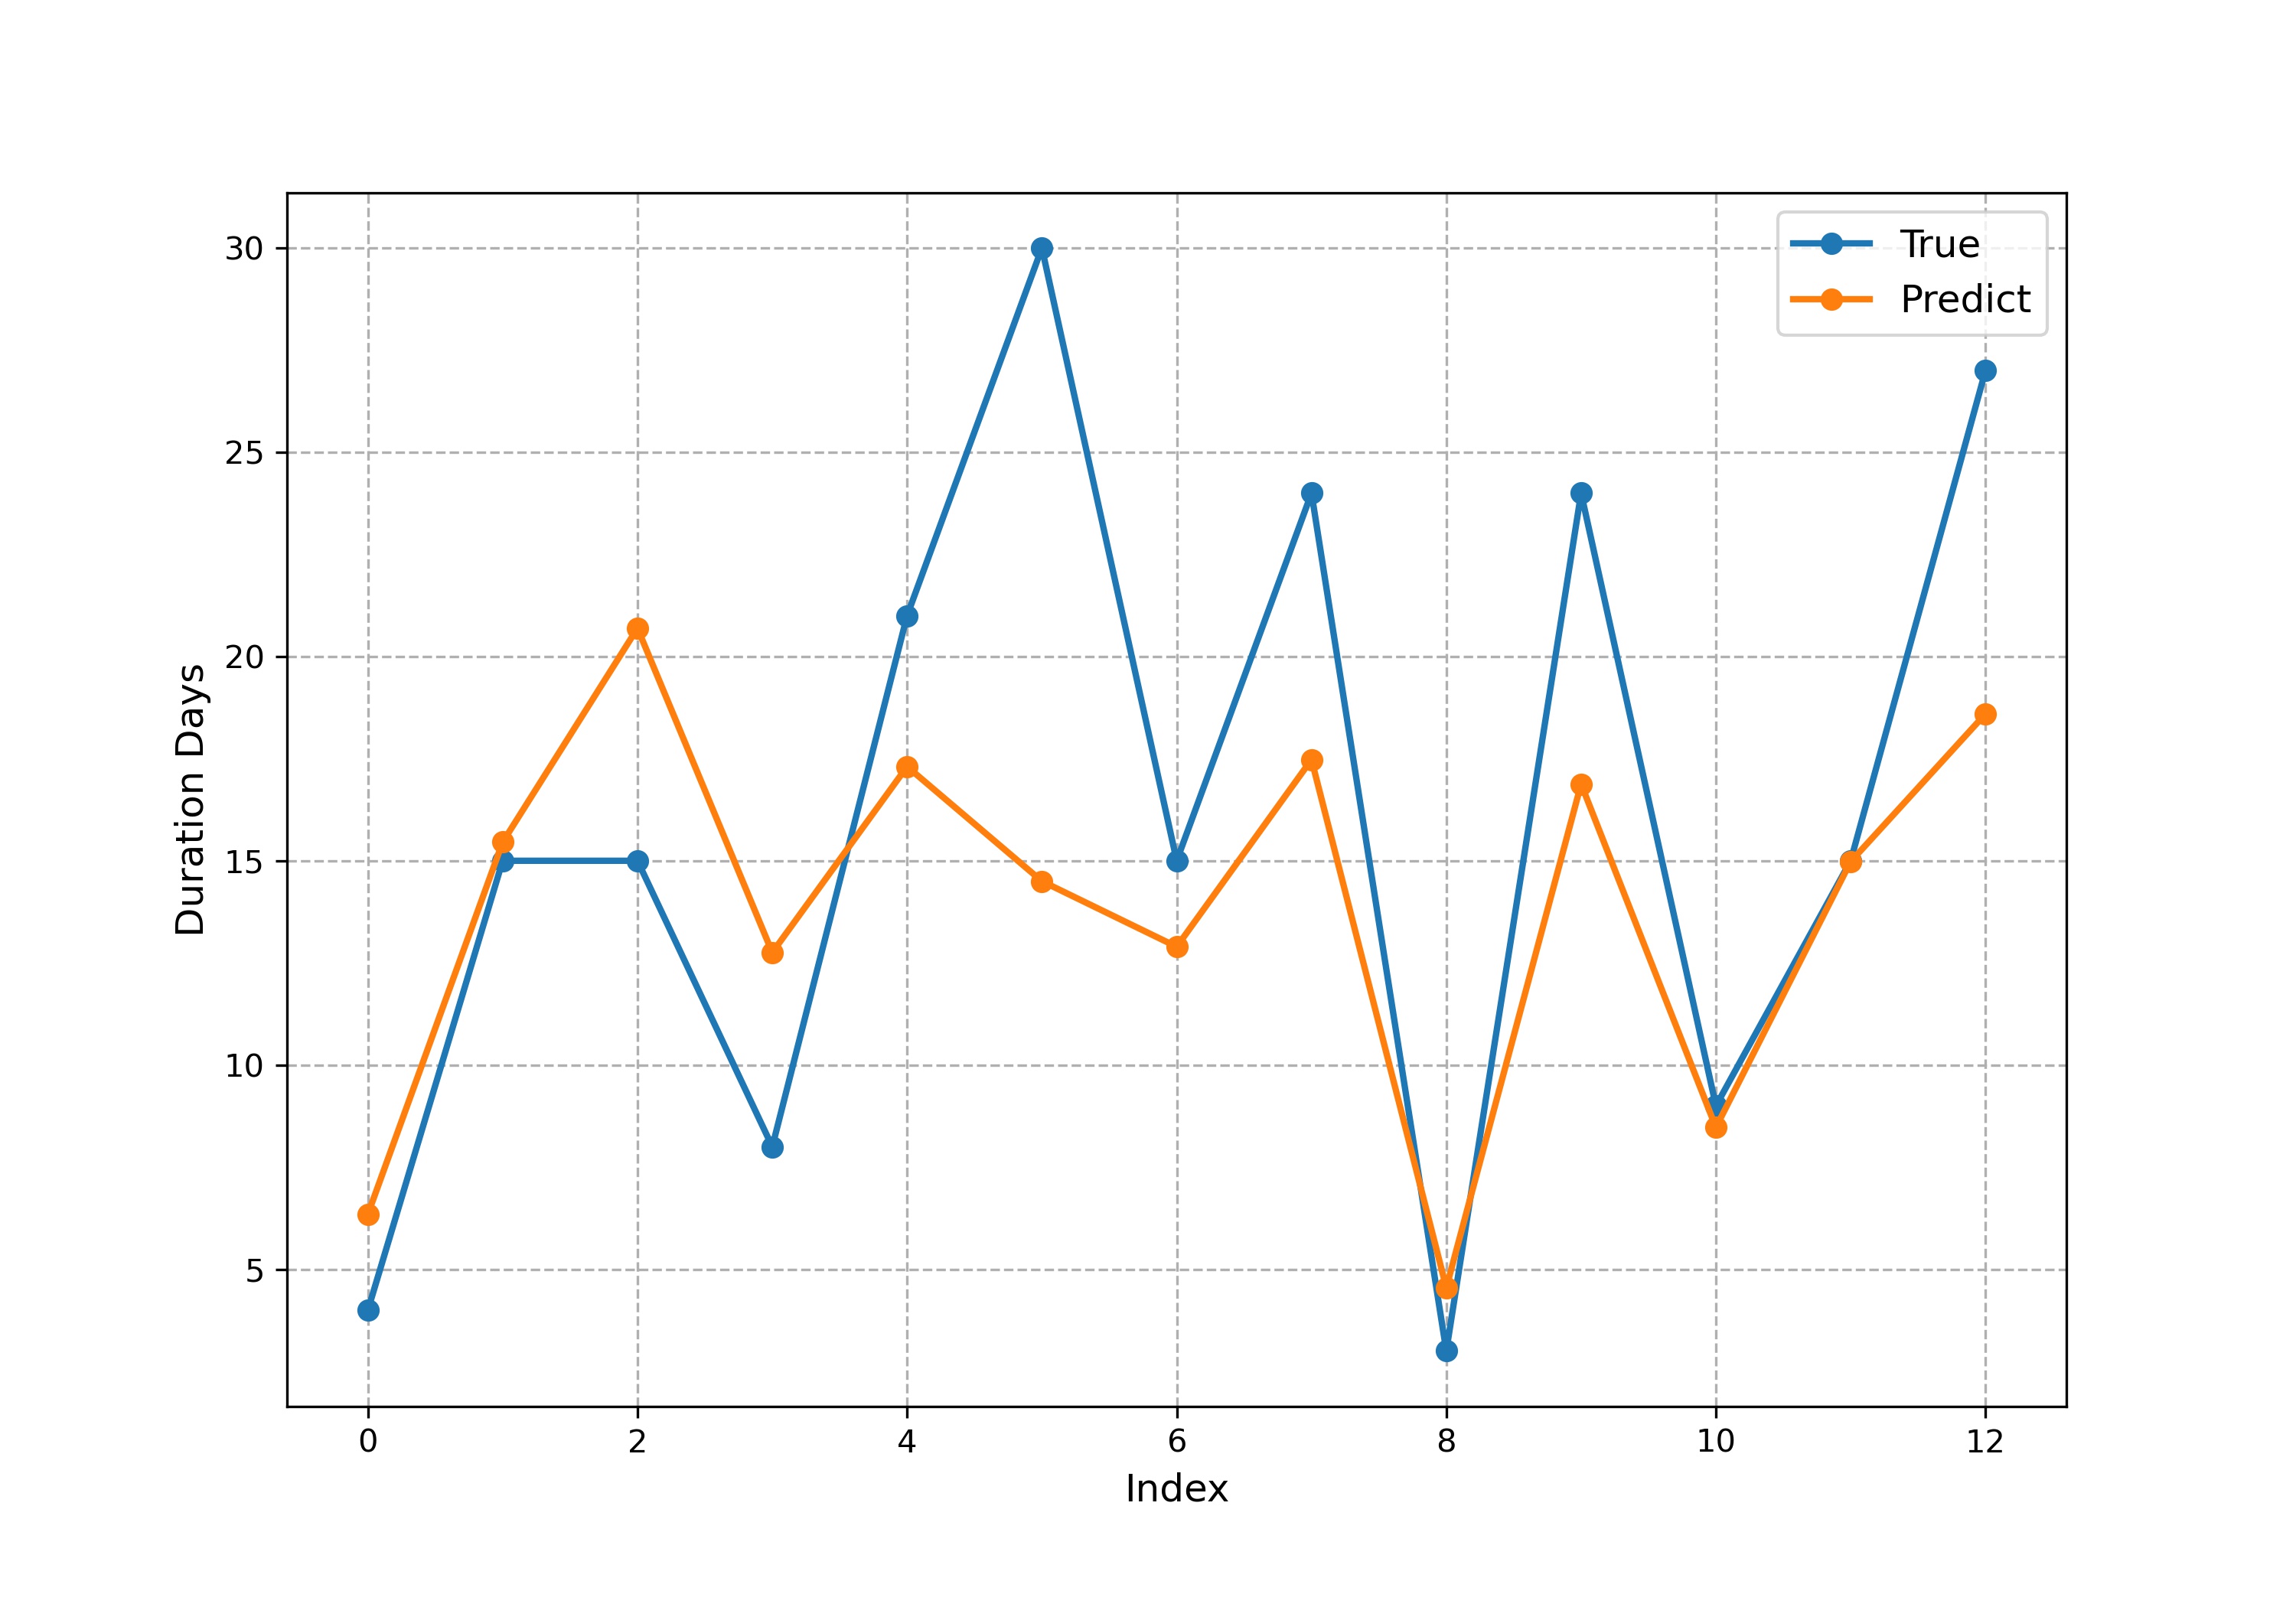
In Section 2, we described two ways to build variable sets: text processing methods based on Word2Vec and BERT. We compared the loss prediction effects of each model under two variable sets and used optuna, to optimize the super parameters of each model. In addition, we used the voting model to combine the prediction results of different models, where the weight of each model was the reciprocal of the RMSE of its prediction results. The voting model, using vectors embedded by BERT, only combines the prediction results of XGBoost and LightGBM. The model parameters used are shown in Table 5 and the prediction results are shown in Table 6, where numbers in boldface indicate the model with the best forecasting performance. We also show the prediction results from the voting model in Figure 4, where the -axis represents the index of testing samples.

Overall, the prediction results of most models were good and fairly consistent, except for the Random Forest model, which performed poorly on the BERT variable set. The voting model demonstrated good prediction results for both variable sets. This suggests that XGBoost and LightGBM may have certain advantages for predicting wildfire duration.
In addition, the prediction effect of each model using BERT was generally better than that of Word2Vec. This shows that the method of manually selecting keywords and constructing variable sets based on Word2Vec is reasonable, and it achieves results similar to the existing mature BERT model. However, the BERT method extracts and contains more effective information than the Word2Vec method, which improves the subsequent model prediction effect.
4.4. Hurricane loss prediction
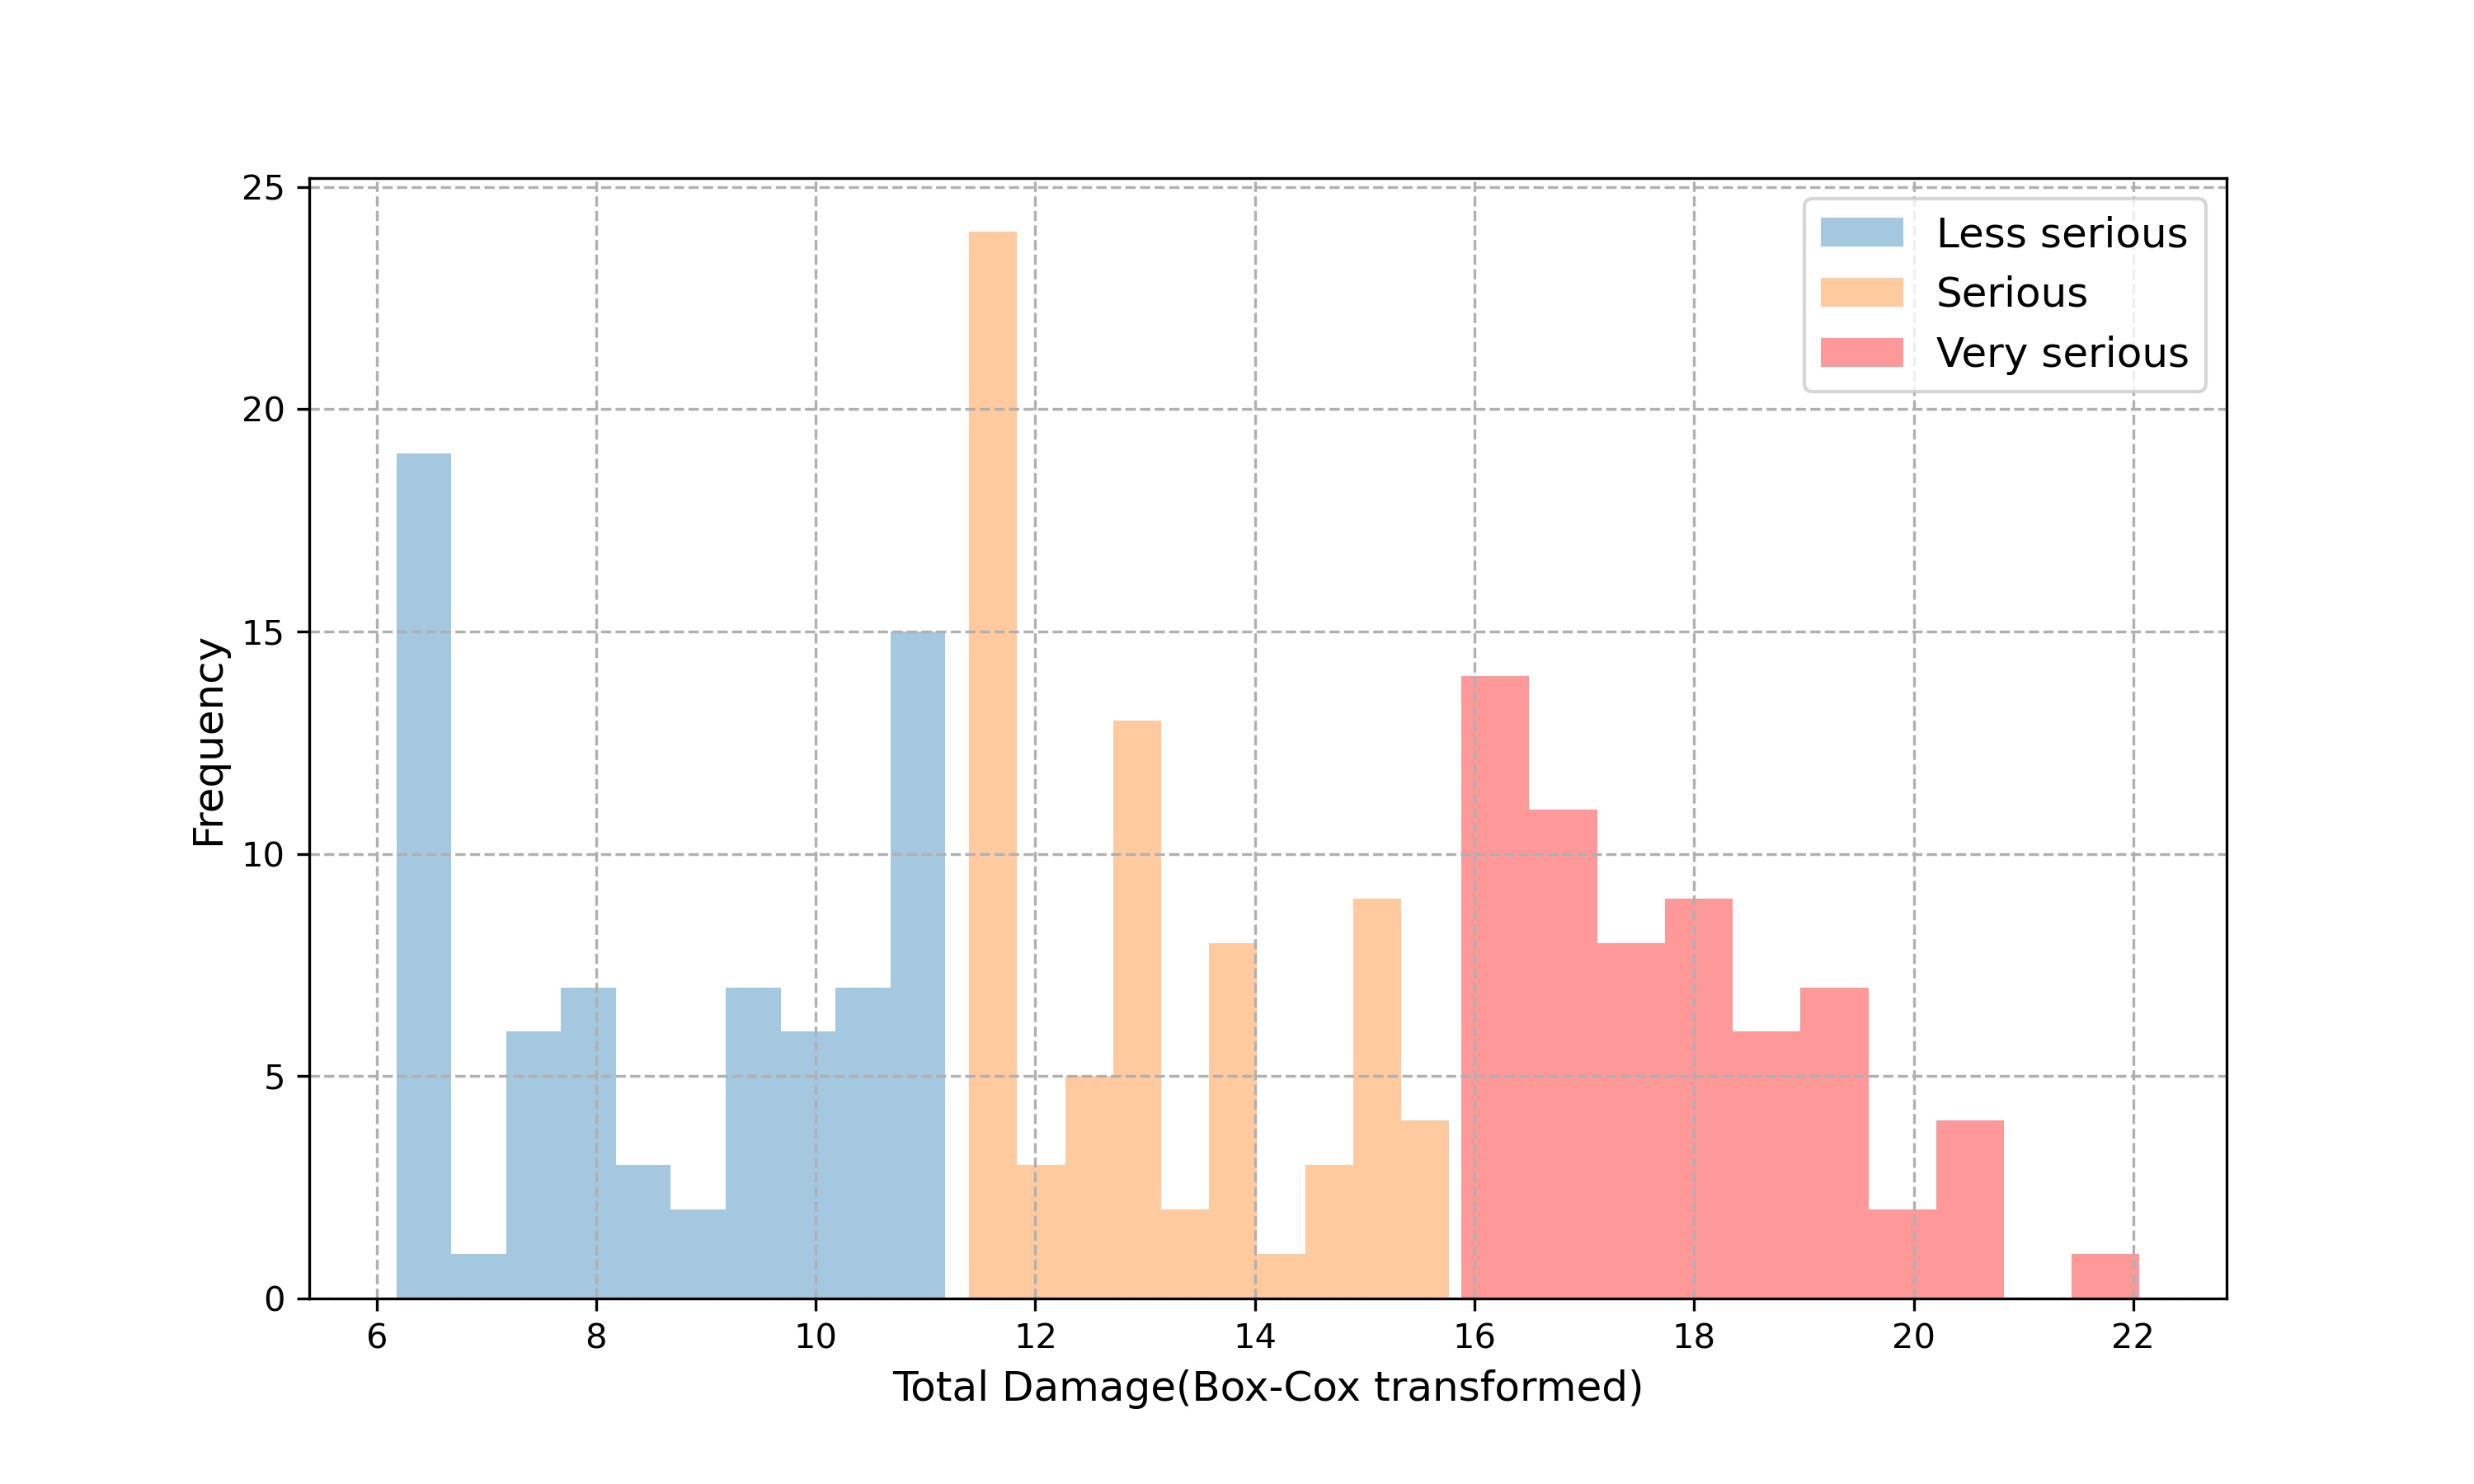
As mentioned in Section 4.2, according to the features of the variable Total Damage, we assigned two threshold values, and divided Total Damage into three levels, less serious, serious, and very serious, as a new label loss index. See Table 7 for more details, where Dmg represents Total Damage. We used a Box-Cox transformation in Figure 5 to unify the order of magnitude and improve the normality of Total Damage.

We constructed training and test sets through stratified sampling from multiple samples, on which we fit three classification models using the same method. We also used a voting model to combine the prediction results, where the weight of each model was determined by the accuracy of its prediction, as shown in Table 8.
According to the results shown in Table 9 and 10, the overall accuracy of the prediction results of each model was around 70%, which indicates that the text information reflects a basic and accurate understanding of the level of hurricane loss. For each level, taking the voting model as an example, the precision, recall, and F1 score indicators on various samples are also around 70%, showing a good classification effect. Although the model may occasionally misclassify some serious disasters as less serious, it still shows good recognition accuracy at the very serious level. This increases our confidence in using text information to determine whether a certain hurricane is very serious and enables us to provide relevant early warning and decision support for such catastrophic events in a timely manner.
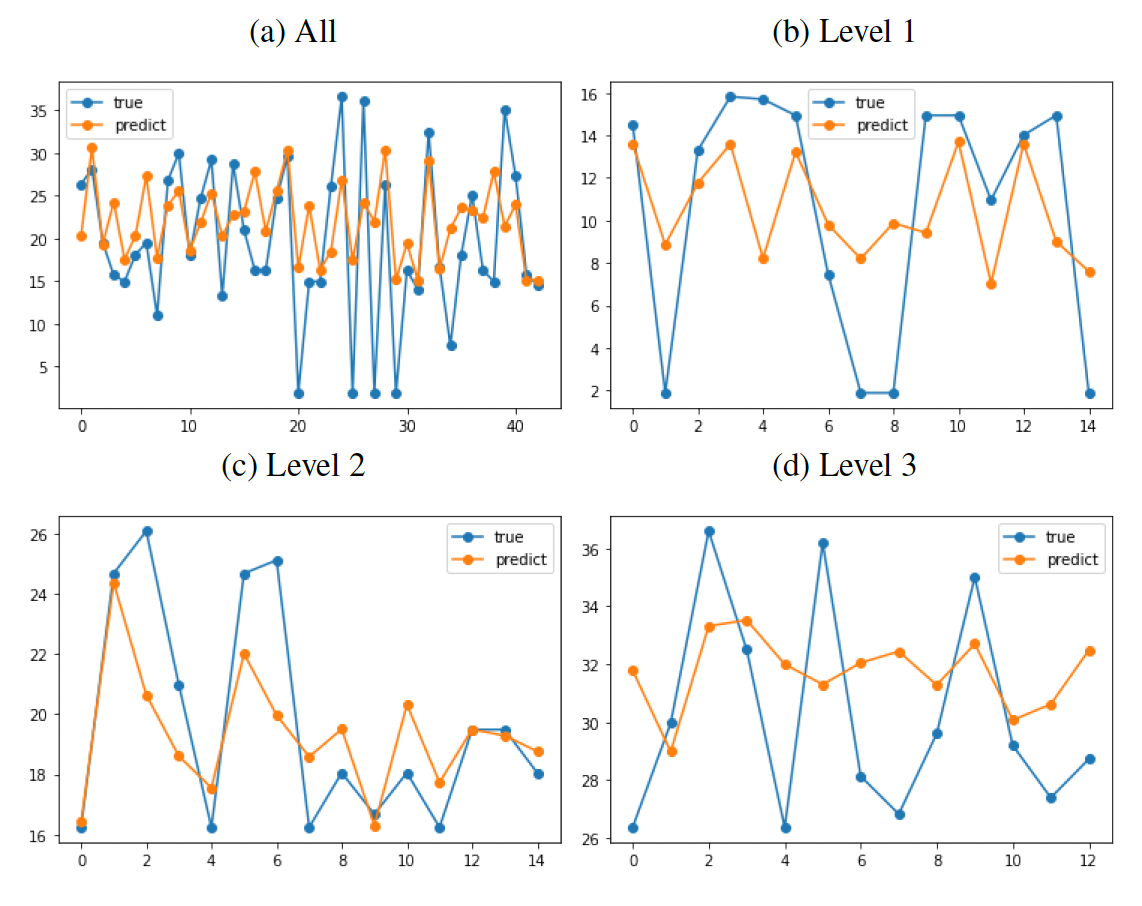
Finally, as with the Section 4.3 wildfire data, we also attempted to directly perform regression prediction on hurricane catastrophe loss after a Box-Cox transformation. However, because of significant differences in losses caused by hurricane catastrophes of different severity levels, in addition to regressing the overall data, we also conducted regression on three severity levels, which we first classified and then regressed. Results are shown in Figure 6, Figure 7, and Table 11.


5. Conclusion
Accurately predicting catastrophe severity has been a challenge in the insurance industry. This research provides a unique and meaningful exploration of this issue based on natural language processing methods and machine learning models. Our results show that using news text information effectively improves the accuracy of predicting catastrophe severity. Both the Word2Vec and BERT methods effectively extract information from news text, while machine learning models, such as Random Forest, XGBoost, and LightGBM, accurately predict catastrophe duration and loss. The BERT method outperformed Word2Vec in text information extraction. Both XGBoost and LightGBM models performed well for predicting the severity of catastrophes when using BERT-generated text vectors. The voting model provides the best prediction performance on wildfire duration and showed nearly 70% accuracy for hurricane losses.
As a fast and open data source, news text information provides a large amount of timely and effective information in the early stages of a catastrophe, which is of great significance for the insurance industry. First, NLP models excel at real-time event detection by scanning news articles and social media posts for mentions of catastrophic events. This early awareness allows insurers to swiftly assess potential risks and inform the relevant departments. Integrating NLP with predictive modeling would potentially improve accuracy by incorporating textual data, such as news reports and expert analysis, into their risk assessment frameworks. Furthermore, during catastrophic events, NLP aids in disaster response and management by analyzing real-time reports and sensor data, providing insurers with the most up-to-date information to deploy resources effectively and adapt their risk assessment strategies in real time. Therefore, using NLP in predictive modeling and disaster response allows insurers to be better equipped to predict, manage, and respond to catastrophic losses.
Finally, we acknowledge the limitation of NLP methods in terms of interpretability compared with classical models. Improving the interpretability of NLP methods is an important area for future research. Future research could also explore other catastrophe types beyond wildfires and hurricanes. In addition, while our research provides valuable insights into catastrophe loss modeling, it is important to acknowledge our dataset’s limitations. The scope of our study is constrained by data availability, and our findings may not fully capture the broader trends and variations that could emerge over a more extended period.
The code for this article is based on Python. It is available at: https://github.com/feng-li/catastrophe-loss-prediction-with-NLP.
Acknowledgment
This research is sponsored by the Casualty Actuarial Society through the 2022 Individual Grant Competition project titled “Catastrophe loss prediction via natural language processing.”
Light GBM is a fast, distributed, high-performance gradient boosting framework based on a decision tree algorithm. It has been used for ranking, classification, and many other machine learning tasks. See details at https://www.analyticsvidhya.com/blog/2017/06/which-algorithm-takes-the-crown-light-gbm-vs-xgboost/