
1. Introduction and motivation
Recent innovations in technology have made it possible to use telematics devices to track individual automobile vehicle usage data, such as mileage, speed, and acceleration. Telematics refers to “the use or study of technology that allows information to be sent over long distances using computers” (Oxford English Dictionary). Telematics are widely used in many fields. The insurance industry has been applying telematics to some practices, such as usage-based insurance, which allows them to collect additional information from driving records beyond traditionally observable policy and driver characteristics. Using a plug-in device or mobile application to collect data, insurers can easily gather relevant information from specific policyholders, providing a more sophisticated method for classifying risk.
Inspired by much interest in this practice, telematics use for automobile insurance has been actively studied in the actuarial literature. Ayuso et al. (2014) published one of the earliest studies to address using telematics for pay-as-you-drive insurance. The authors analyzed telematics data and found that vehicle usage differed substantially between novice and experienced young drivers.
Other research has also demonstrated that telematics provide valuable additional data that supplements traditional rating variables. According to Ayuso et al. (2016), gender—a widely used traditional rating variable—is not a significant rating factor after controlling for observed driving factors available through telematics. In a later study, Ayuso et al. (2019) found a significant effect of driving habits on the expected number of claims. Guillen et al. (2019) found that telematics devices help to more precisely predict excess zeros in claim frequencies. Other studies that demonstrated the efficacy of telematics information for improving traditional risk classification models include Boucher (2017), Gao et al. (2019), Pesantez-Narvaez et al. (2019), and Pérez-Marín et al. (2019). Recently, Guillen et al. (2020; 2021) used telematics data to analyze near miss events.
Despite ongoing academic and industry research, access to telematics data has been limited because of privacy concerns; this has made it difficult for actuarial and insurance community members to apply more diverse analytics to telematics data. To address this barrier, So, Boucher, and Valdez (2021) proposed a novel algorithm that generates a synthetic dataset of driver telematics by emulating an existing insurance portfolio. However, the authors’ algorithm replicates the distributions of independent and dependent variables almost identically, which might make the use of the resulting synthetic dataset less practical if overall characteristics of the target portfolio differ substantially from the original telematics data. Therefore, we proposed an advanced algorithm of adaptive telematics data generation that incorporates prior knowledge of an insurance market’s or company’s specific characteristics. We used the synthetic dataset from So, Boucher, and Valdez (2021) as the source data for our algorithm and generated an output dataset with modified distributions of the observed responses and covariates. This approach could provide a concrete method for generating synthetic telematics datasets based on insurers’ various needs.
The remaining sections are organized as follows. Section 2 introduces the general concept and characteristics of telematics information and synthetic datasets. Section 3 covers our main work, which includes constructing the simulation engine for adaptive telematics (SEAT) data, along with relevant theoretical foundations and actual implementation. Section 4 illustrates an empirical application of the proposed method by generating a portfolio that matches the South Korean insurance market. We also discuss the characteristics of the generated portfolio compared with the original portfolio. We conclude with remarks in Section 5.
2. Telematics and synthetic data
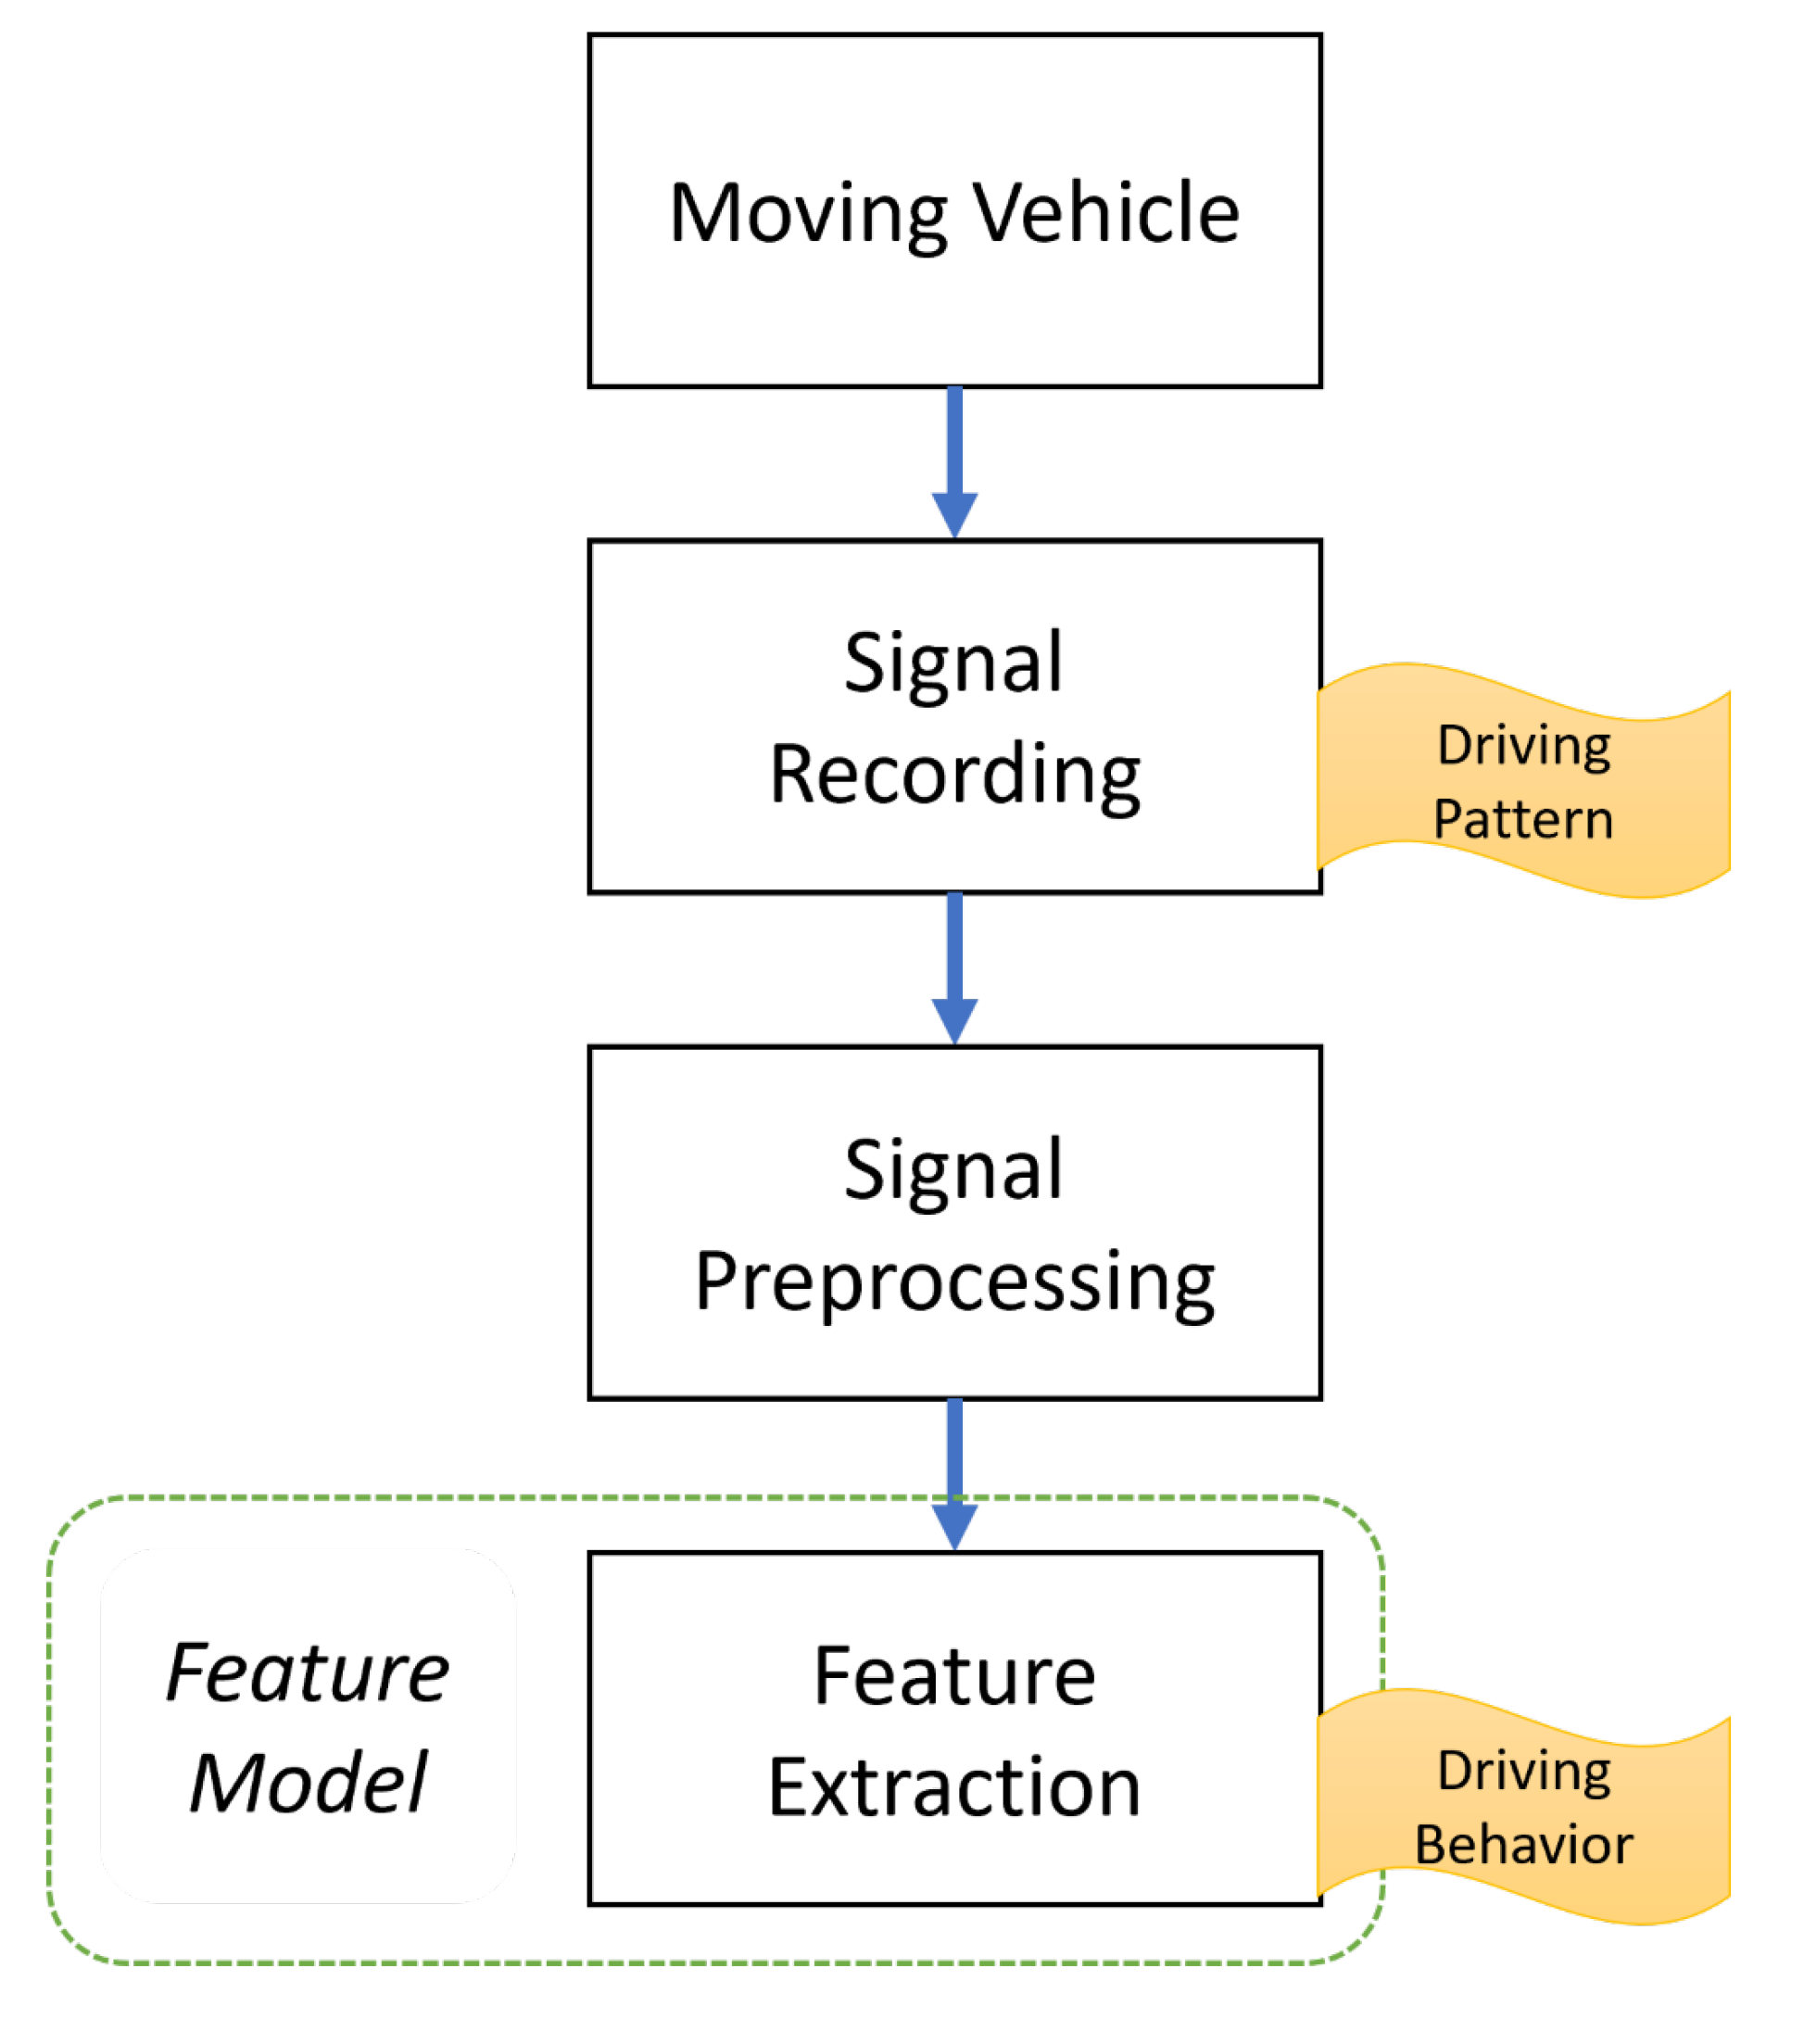
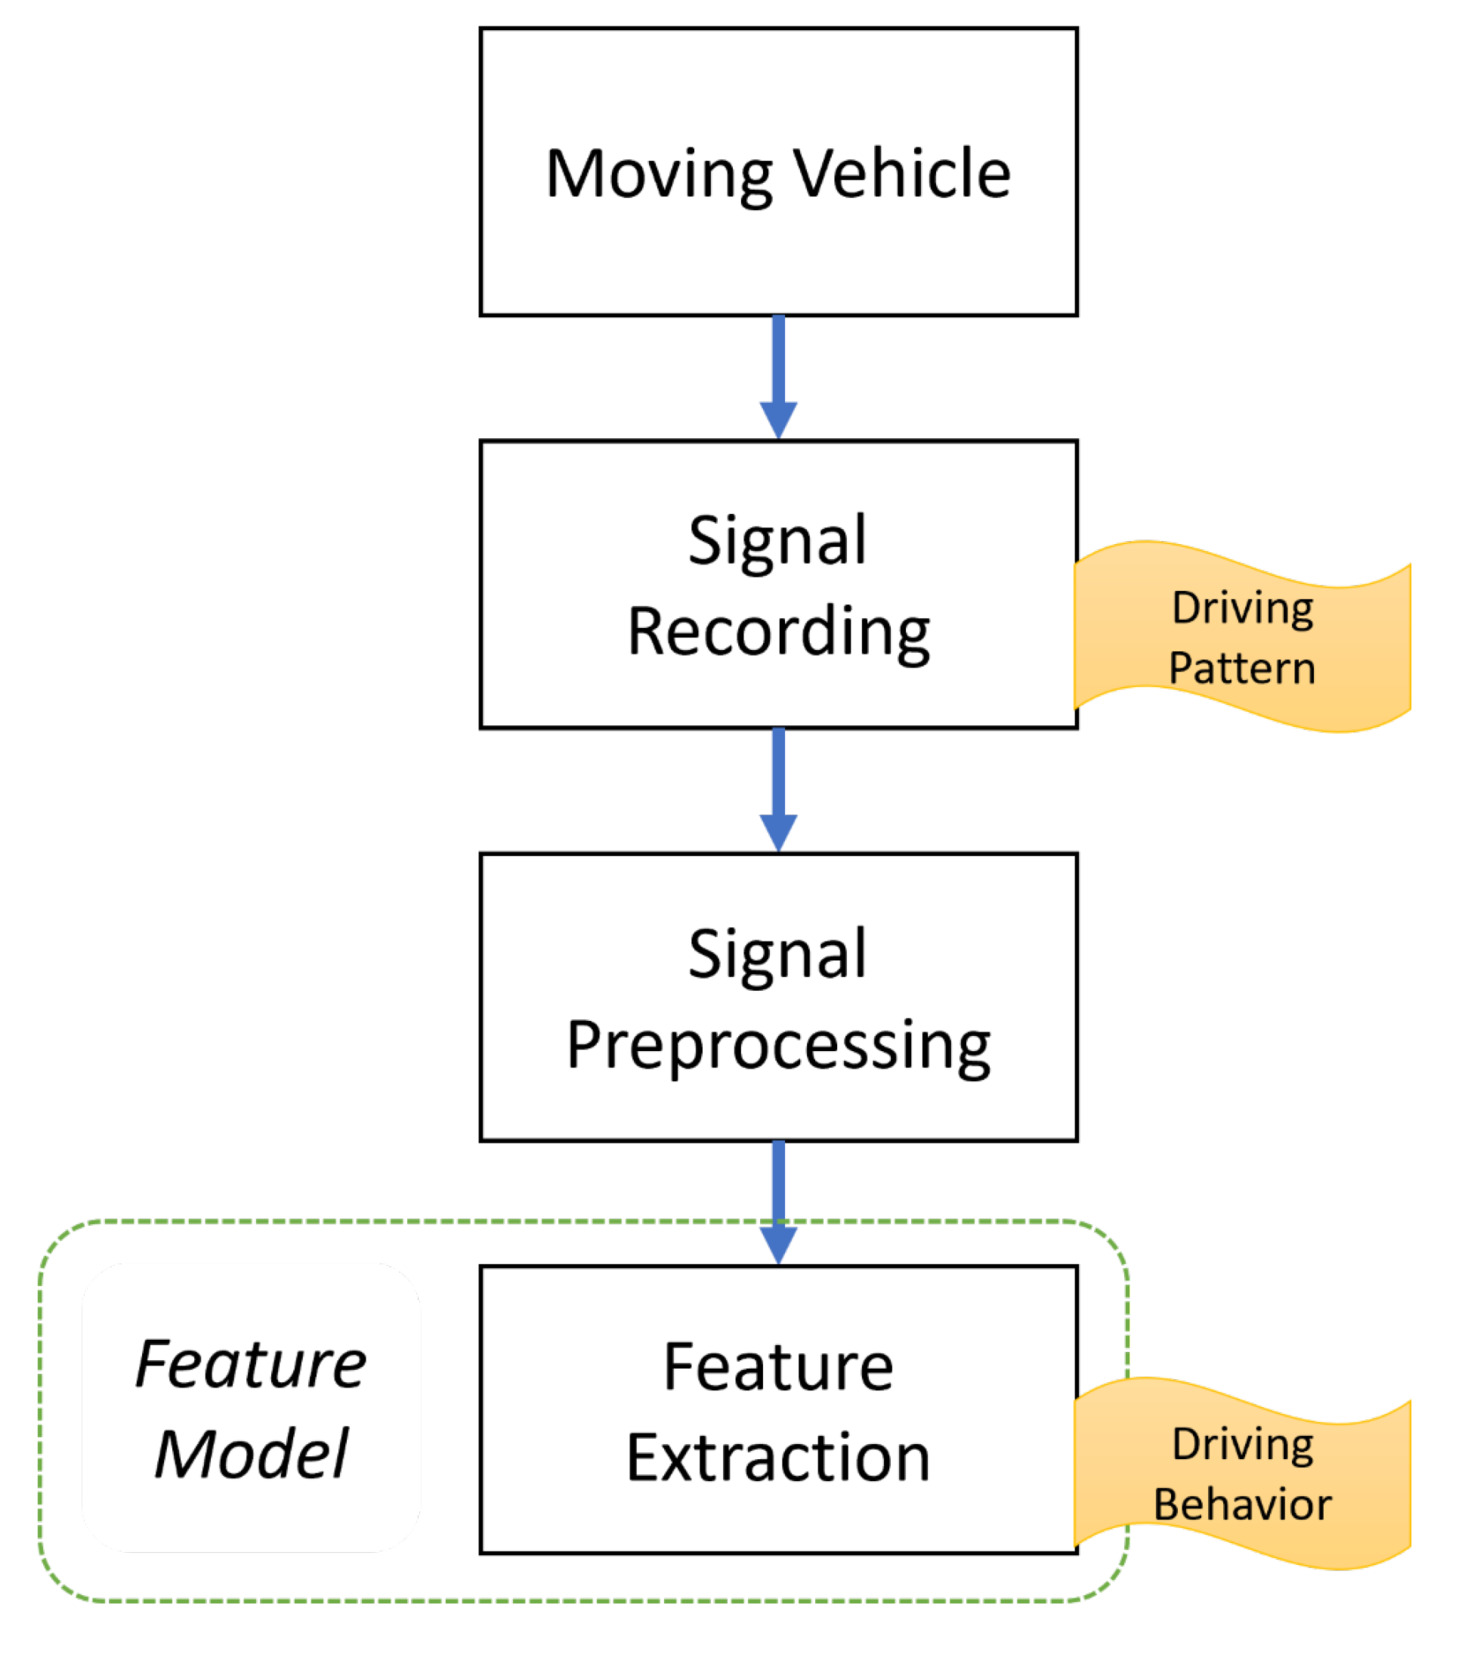
As mentioned in Section 1, vehicle usage telematics data are collected and transmitted on a real-time basis; therefore, telematics data collection and processing differs substantially from that of traditional data. According to Johanson et al. (2014), a driving signal dataset covering 1,000 vehicles will generate about 560 gigabytes per day. Since a typical automobile insurance portfolio includes millions of drivers, problems may arise regarding the effectiveness of data recording, data privacy (Duri et al. 2002, 2004), and feature extraction. Telematics data feature extraction is illustrated in Figure 1.
Conventionally, telematics data have been feature engineered into specific forms of attributes that are meaningful and ready to use for predicting auto insurance claims. Table 1 introduces a brief list of summary statistics that can be used in practice (Gerardo and Lee 2009).
Recently, Wüthrich (2017) and Gao and Wüthrich (2018) suggested a different framework for telematics data feature extraction and dimension reduction. Since telematics data inherently form a continuum of observations, the authors considered the velocity-acceleration heatmaps and analyzed them via a k-means clustering algorithm to classify car drivers’ risk. Henceforth, we focus on emulation and analysis of a summarized form of telematics data rather than of raw data, as found in most actuarial studies.
However, finding a publicly accessible telematics dataset, even in a summarized form, has been extremely difficult, owing to privacy concerns of insurers who are reluctant to provide their driving records to the public. Given this, insurers are increasingly interested in using synthetic data, because it is free from privacy issues yet maintains the original dataset’s essential characteristics. Synthetic data can also be easily implemented for construction and validation of statistical models that improve risk classifications. For example, Gan and Valdez (2018) created a synthetic dataset of a large variable annuity portfolio that can be used to develop annuity valuation or hedging techniques such as metamodeling. Gabrielli and Wüthrich (2018) proposed an individual claims history simulation machine that helps researchers calibrate their own individual or aggregate reserving models. Cote et al. (2020) applied generative adversarial networks to synthesize a property and casualty ratemaking dataset, which could be used for predictive analytics in the ratemaking process. Avanzi et al. (2021) introduced an individual insurance claims simulator with feature control, which allows modelers to assess the validity of their reserving methods by back-testing.
To the best of our knowledge, So, Boucher, and Valdez (2021) is the first study to address synthesizing a dataset that includes features engineered from an actual telematics dataset. The authors used a three-stage process that applies various machine learning algorithms. First, they generated feature variables of a synthetic portfolio via an extended version of the synthetic minority oversampling technique (Chawla et al. 2002). Second, they simulated a corresponding number of claims via binary classifications using feedforward neural networks. Finally, they simulated corresponding aggregated amounts of claims via regression feedforward neural networks.
Despite its novelty, the extended synthetic minority oversampling algorithm for feature generation produced almost identical distributions of the traditional and telematics feature variables from the synthetic and original datasets, as shown in the Appendix of So, Boucher, and Valdez (2021). This poses a concern for researchers and practitioners wishing to use a synthetic dataset, given disparities in target market and original data feature portfolios. Therefore, we propose an innovative simulation engine, SEAT, that uses target market prior information to synthesize a feature portfolio similar to that of the target market.
3. Simulation of adaptive telematics data
3.1. Desirable characteristics of a synthetic telematics dataset
Before introducing SEAT in detail, we will discuss the agreed-upon desirable characteristics of a synthetic dataset. First, the dataset should be accessible to the public. As previously mentioned, limited access to telematics data is a major obstacle to developing and back-testing ratemaking methods with telematics features. Second, the dataset should be flexible enough to satisfy the needs of modelers with diverse and specific interests. Finally, dataset granularity should be assured so that the data can be used to train, test, and apply various features related to individual risk classification via predictive modeling.
Therefore, we aimed to develop a publicly available method that allows anyone to access the sample dataset, data generation routine, and source codes from the following link (https://github.com/bheeso/SEAT.git). The resulting dataset is fully granular and flexible in that it can match various target market profiles of interest. In future research, we hope to incorporate other important characteristics, such as longitudinality and multiple lines of business to emulate serial and/or between-coverage dependence.
3.2. Description of the source data
As discussed earlier, SEAT uses synthetic insurance claims data from So, Boucher, and Valdez (2021; http://www2.math.uconn.edu/~valdez/data.html, accessed on April 30, 2025) as the data source, which consists of traditional and telematics features and two response variables.
The source dataset contains 52 variables, which can be categorized into three groups:
-
11 traditional features, such as insurance exposure, age of driver, and main use of the vehicle.
-
39 telematics features, such as total distance driven and number of sudden accelerations.
-
Two response variables that describe the claim frequency and aggregated claim amounts.
Table 2 shows the name, description, and data attributes of the available features in the dataset. Note that feature attributes are important because they affect the data generation scheme that involves random perturbation, as elaborated in Step 4 of Section 3.3. For detailed information and preliminary analysis of the dataset, see Section 3 of So, Boucher, and Valdez (2021).
3.3. Adaptive data generation scheme
The proposed algorithm in SEAT uses predetermined distributions of the traditional covariates such as sex, region, age, and main use of the insured vehicle, which are easily accessible in the target market. In our source dataset, they are named Insured.sex, Region, Insured.age, and Car.use, respectively.
Here we assume that we know the benchmark ratios of classes in four covariates (Insure.age, Insure.sex, Region, Car.use) and set these ratios as the inputs to the algorithm. Table 3 shows how these inputs are defined. For example, (in Table 3) indicates the ratio of insured who are between ages 16 and 30. We produced an adaptive portfolio by applying the SEAT algorithm, based on the ratios of the four variables.
When the input values are provided, the following algorithm generates data that are adapted from the source data:
-
Step 1: Calculate conditional distributions of the benchmark covariates (see Figure 2) using source data and inputs. The four variables may be colinear, so we used modified conditional distributions to reflect such collinearities in the algorithm. To obtain the modified conditional distributions, we used the following probability rules where represents the probabilities for the target distribution. (For simplicity, we write , and as and respectively.)
P∗(R|F)=P∗(R∩F)P∗(R∩F)+P∗(U∩F) and P∗(R|M)=P∗(R∩M)P∗(R∩M)+P∗(U∩M), where
P∗(R∩F)=P(R∩F)P∗(R)P(R), P∗(U∩F)=P(U∩F)P∗(U)P(U),P∗(R∩M)=P(R∩M)P∗(R)P(R), P∗(U∩M)=P(U∩M)P∗(U)P(U),
and is the sample ratio calculated from the source data. One can easily check that (1) is equivalent to P∗(F|R)=P(F|R) and P∗(F|U)=P(F|U). We may call and adjustment factors since they play an important role in adjusting ratios of the original portfolio to ratios in the adaptive portfolio. Other conditional ratios are subsequently calculated in the same way.
-
Step 2: Create a random sample from the standard uniform distribution and categorize it based on each conditional distribution in the order of
Insured.sex,Region,Insured.age, andCar.use. First, one can sample a random observation forInsured.sexfrom its benchmark distribution and If a uniform random number is categorized into female (F), then, in the next stage, a newly generated uniform random number is categorized based on the conditional distribution ofInsured.sexand -
Step 3: By repeating Step 2 times, obtain configurations of the four traditional covariates where is the number of total observations in the adaptive portfolio to be generated.
-
Step 4: From the original portfolio, sample observations of the remaining variables (telematics and claims information) from their empirical distributions with Gaussian white noise, conditional on each configuration of the benchmark covariates. Note that the number of possible combinations of the benchmark covariates increases exponentially, depending on the number of covariates and levels of a covariate. Therefore, many cases may have configurations with sparse empirical observations. To avoid repeatedly producing the same samples, we twisted samples slightly using Gaussian white noise. For example, for configuration the corresponding independent variables (both telematics and remaining traditional features) number of claims and total amount of claims are generated as follows: T(j)i≃˜F−1T(j)(Ui|Ci)+σZi,Ni≃˜F−1N(Ui|Ci)+σZi,Si=˜F−1S(Ui|Ci)+σZi, where is a random sample from the standard normal distribution, is the number of telematics and remaining traditional features, is the empirical distribution of feature given the configuration of the benchmark covariate and is the input that controls the degree of random perturbation. For simplicity and convenience of employing the SEAT algorithm, we use the same to all covariates. However, to give an equivalent degree of randomness to all covariates, their scales are adjusted by centering and scaling with the median and interquartile range. For example, for a variable the scale-adjusted variable is defined as where and denote the first, second, and third quartile of the observed values of respectively. Note that for ordinal variables (for example, number of claims or number of sudden brakes), and/or are rounded to the nearest ordinal number, respectively. We also set an upper limit and lower limit of each variable so that values are inside the expected interval.

Algorithm 1 summarizes the data generation steps for given input values. Note that the proposed algorithm provides room for flexibility by (sub)data generation. For example, if a modeler is interested in analyzing policyholders in urban areas, one can impose so that the resulting dataset only contains policyholders in urban areas and their corresponding features.
4. Empirical application: Synthetized telematics data for the South Korean insurance market
To test the effectiveness of SEAT, we generated a synthetized telematics dataset tailored to the South Korean insurance market with predetermined inputs and analyzed its properties compared with the original telematics dataset. We used the South Korean insurance market as a case study, but the proposed algorithm is applicable to any national or regional market, as well as to any industry or company, as it can be adjusted based on the specific interests of the modeler.
The South Korean insurance market has grown rapidly in recent years, ranking seventh in total premium volume in 2020 (Korean Insurance Research Institute 2021), with a global market share of 3.1%. Nevertheless, the use of telematics data both in actuarial practice and in research is still developing in South Korea. Although Han (2016) discussed regulatory and legal issues regarding telematics data for usage-based insurance in the South Korean insurance market, follow-up research on implementation of ratemaking methods with telematics data is lacking, partially due to the scarcity of publicly available data. Furthermore, only one company, Carrot Insurance, actively uses driver telematics information in their ratemaking scheme. We therefore extracted basic profiles of the South Korean insurance market from various sources (The Korean National Police Agency 2020; Korean Statistical Information Service 2020a, 2020b; The Korean Ministry of Land, Infrastructure and Transport 2020) and used these as the inputs to generate the adaptive portfolio. Table 4 provides the input specification of the benchmark covariates used in dataset generation.
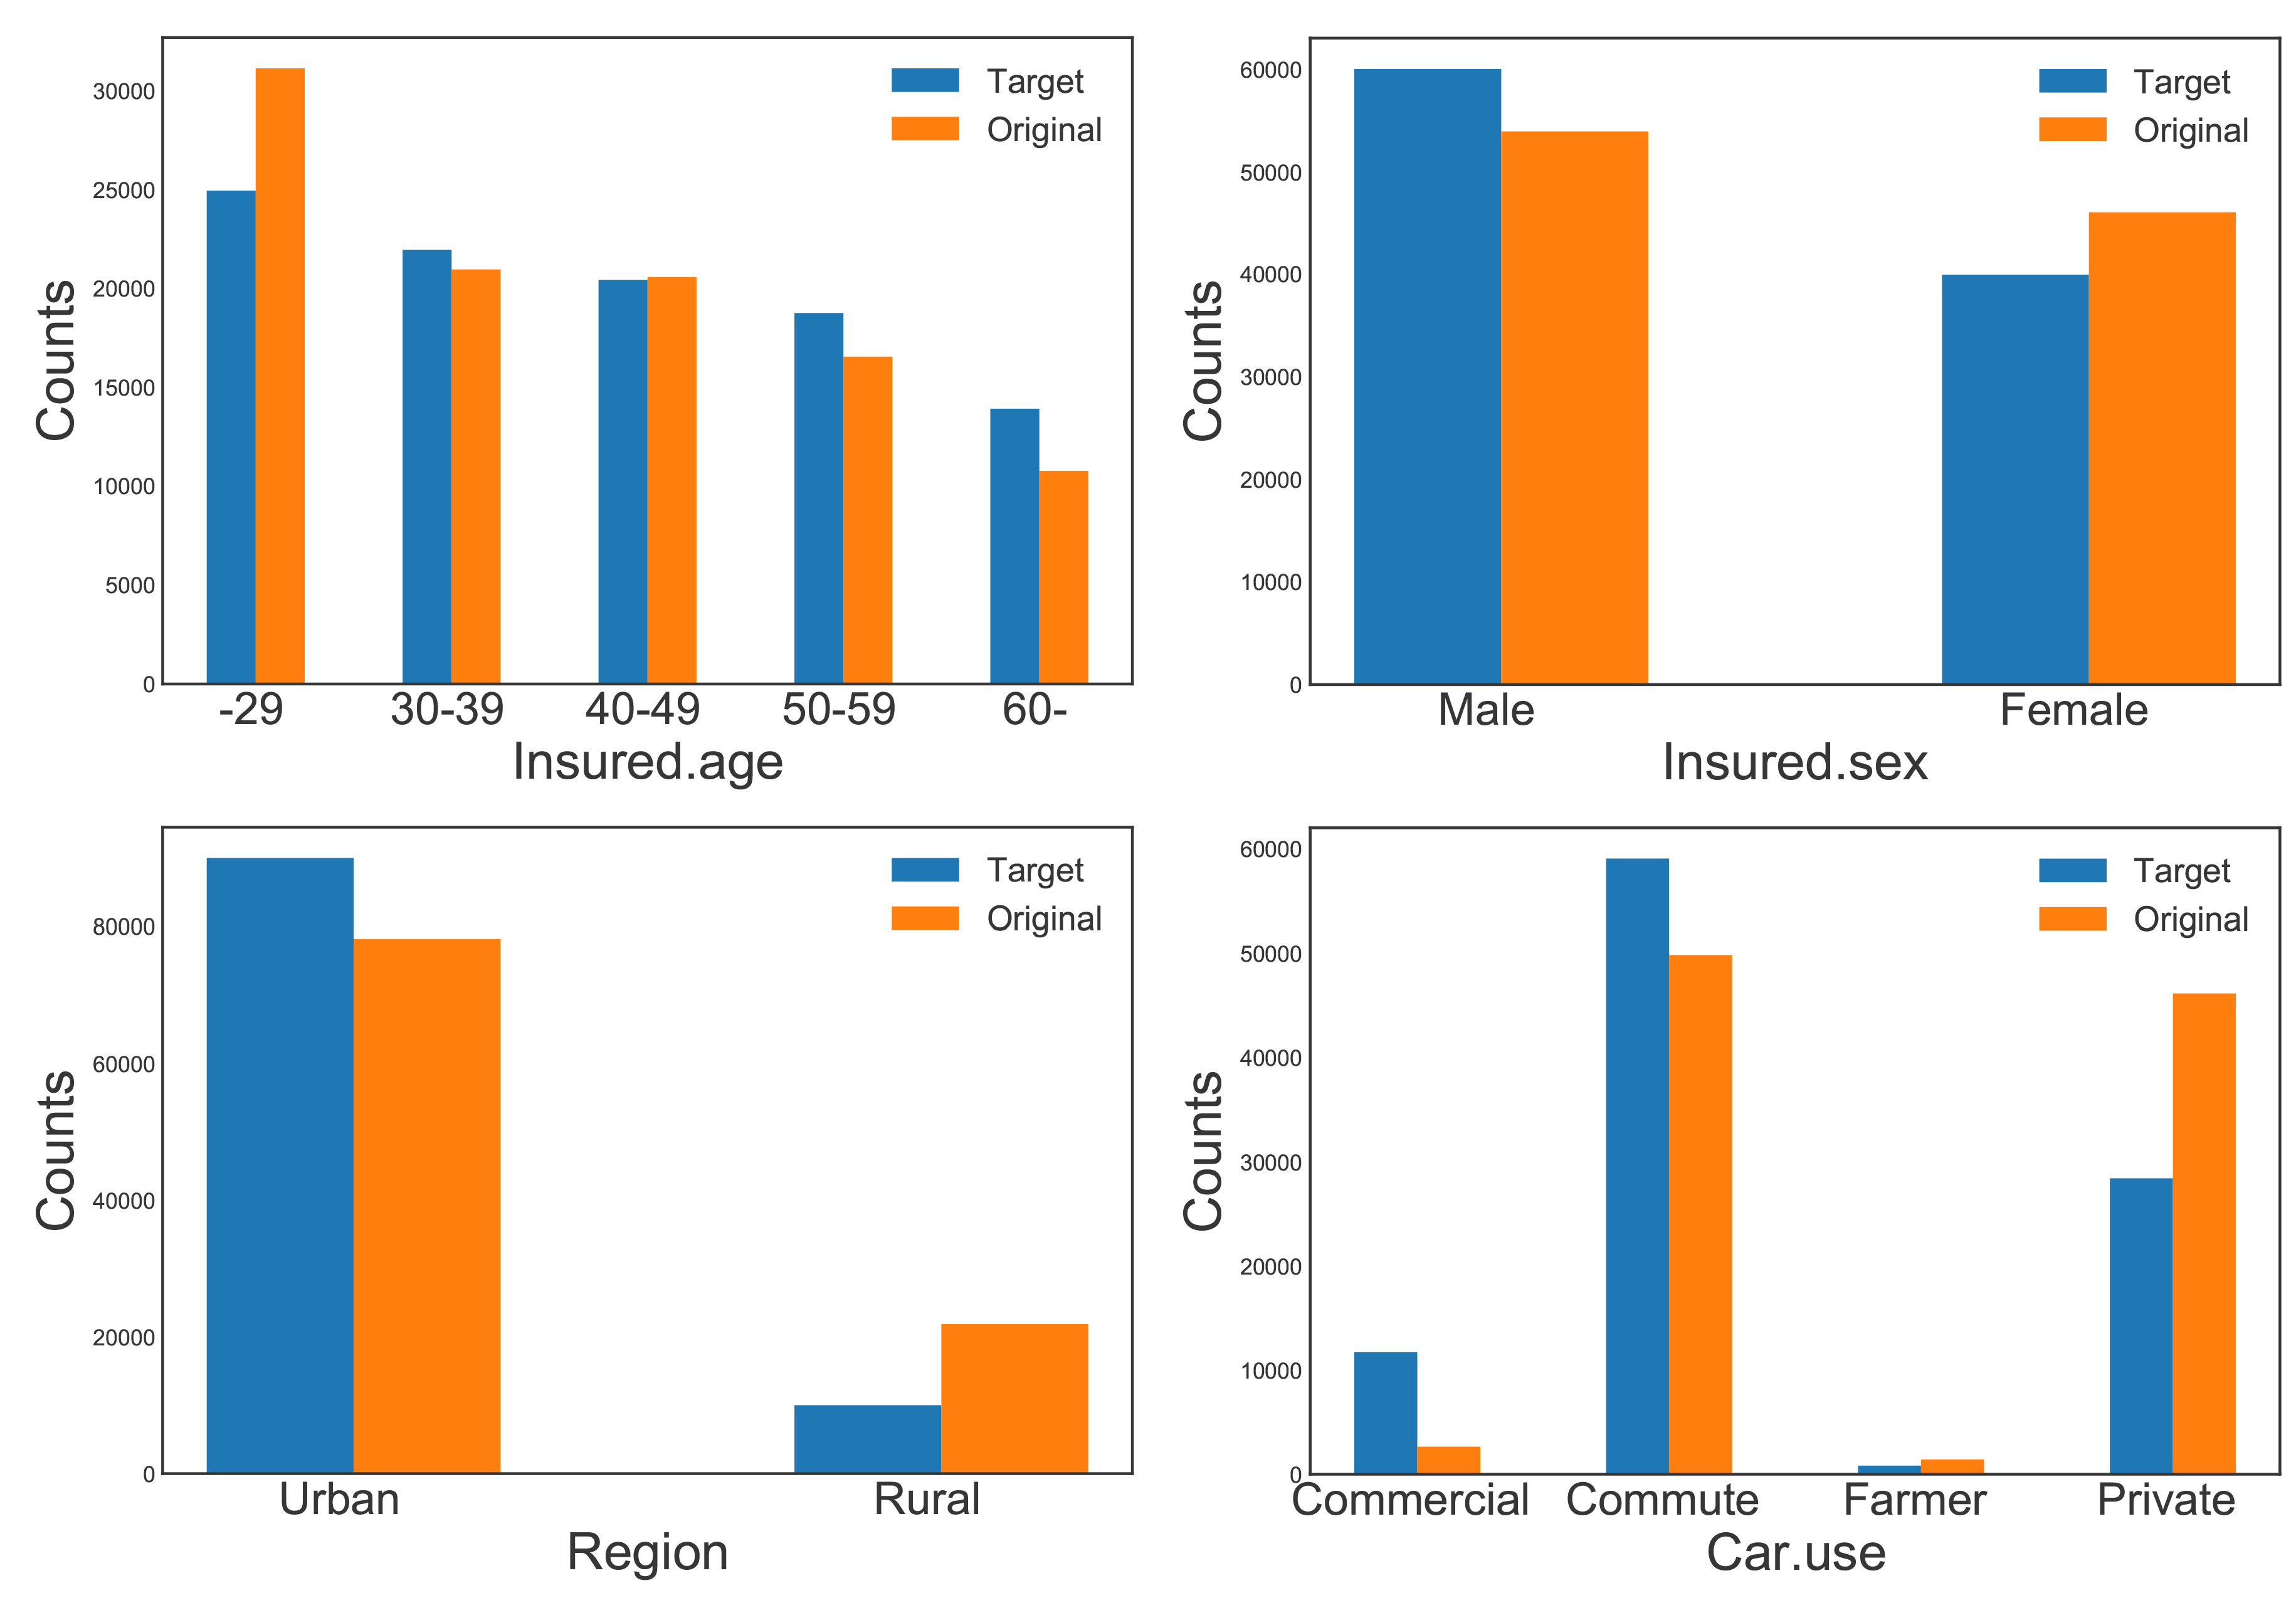
Running the algorithm (as described in Section 3.3) with the input specifications produced an adaptive portfolio; the resulting ratios of target variables are summarized in Table 5 and Figure 3. The ratios confirm that the proposed algorithm effectively replicated specified benchmark covariates to mimic the target market accordingly, as we expected.
_and_original_ratios.png)
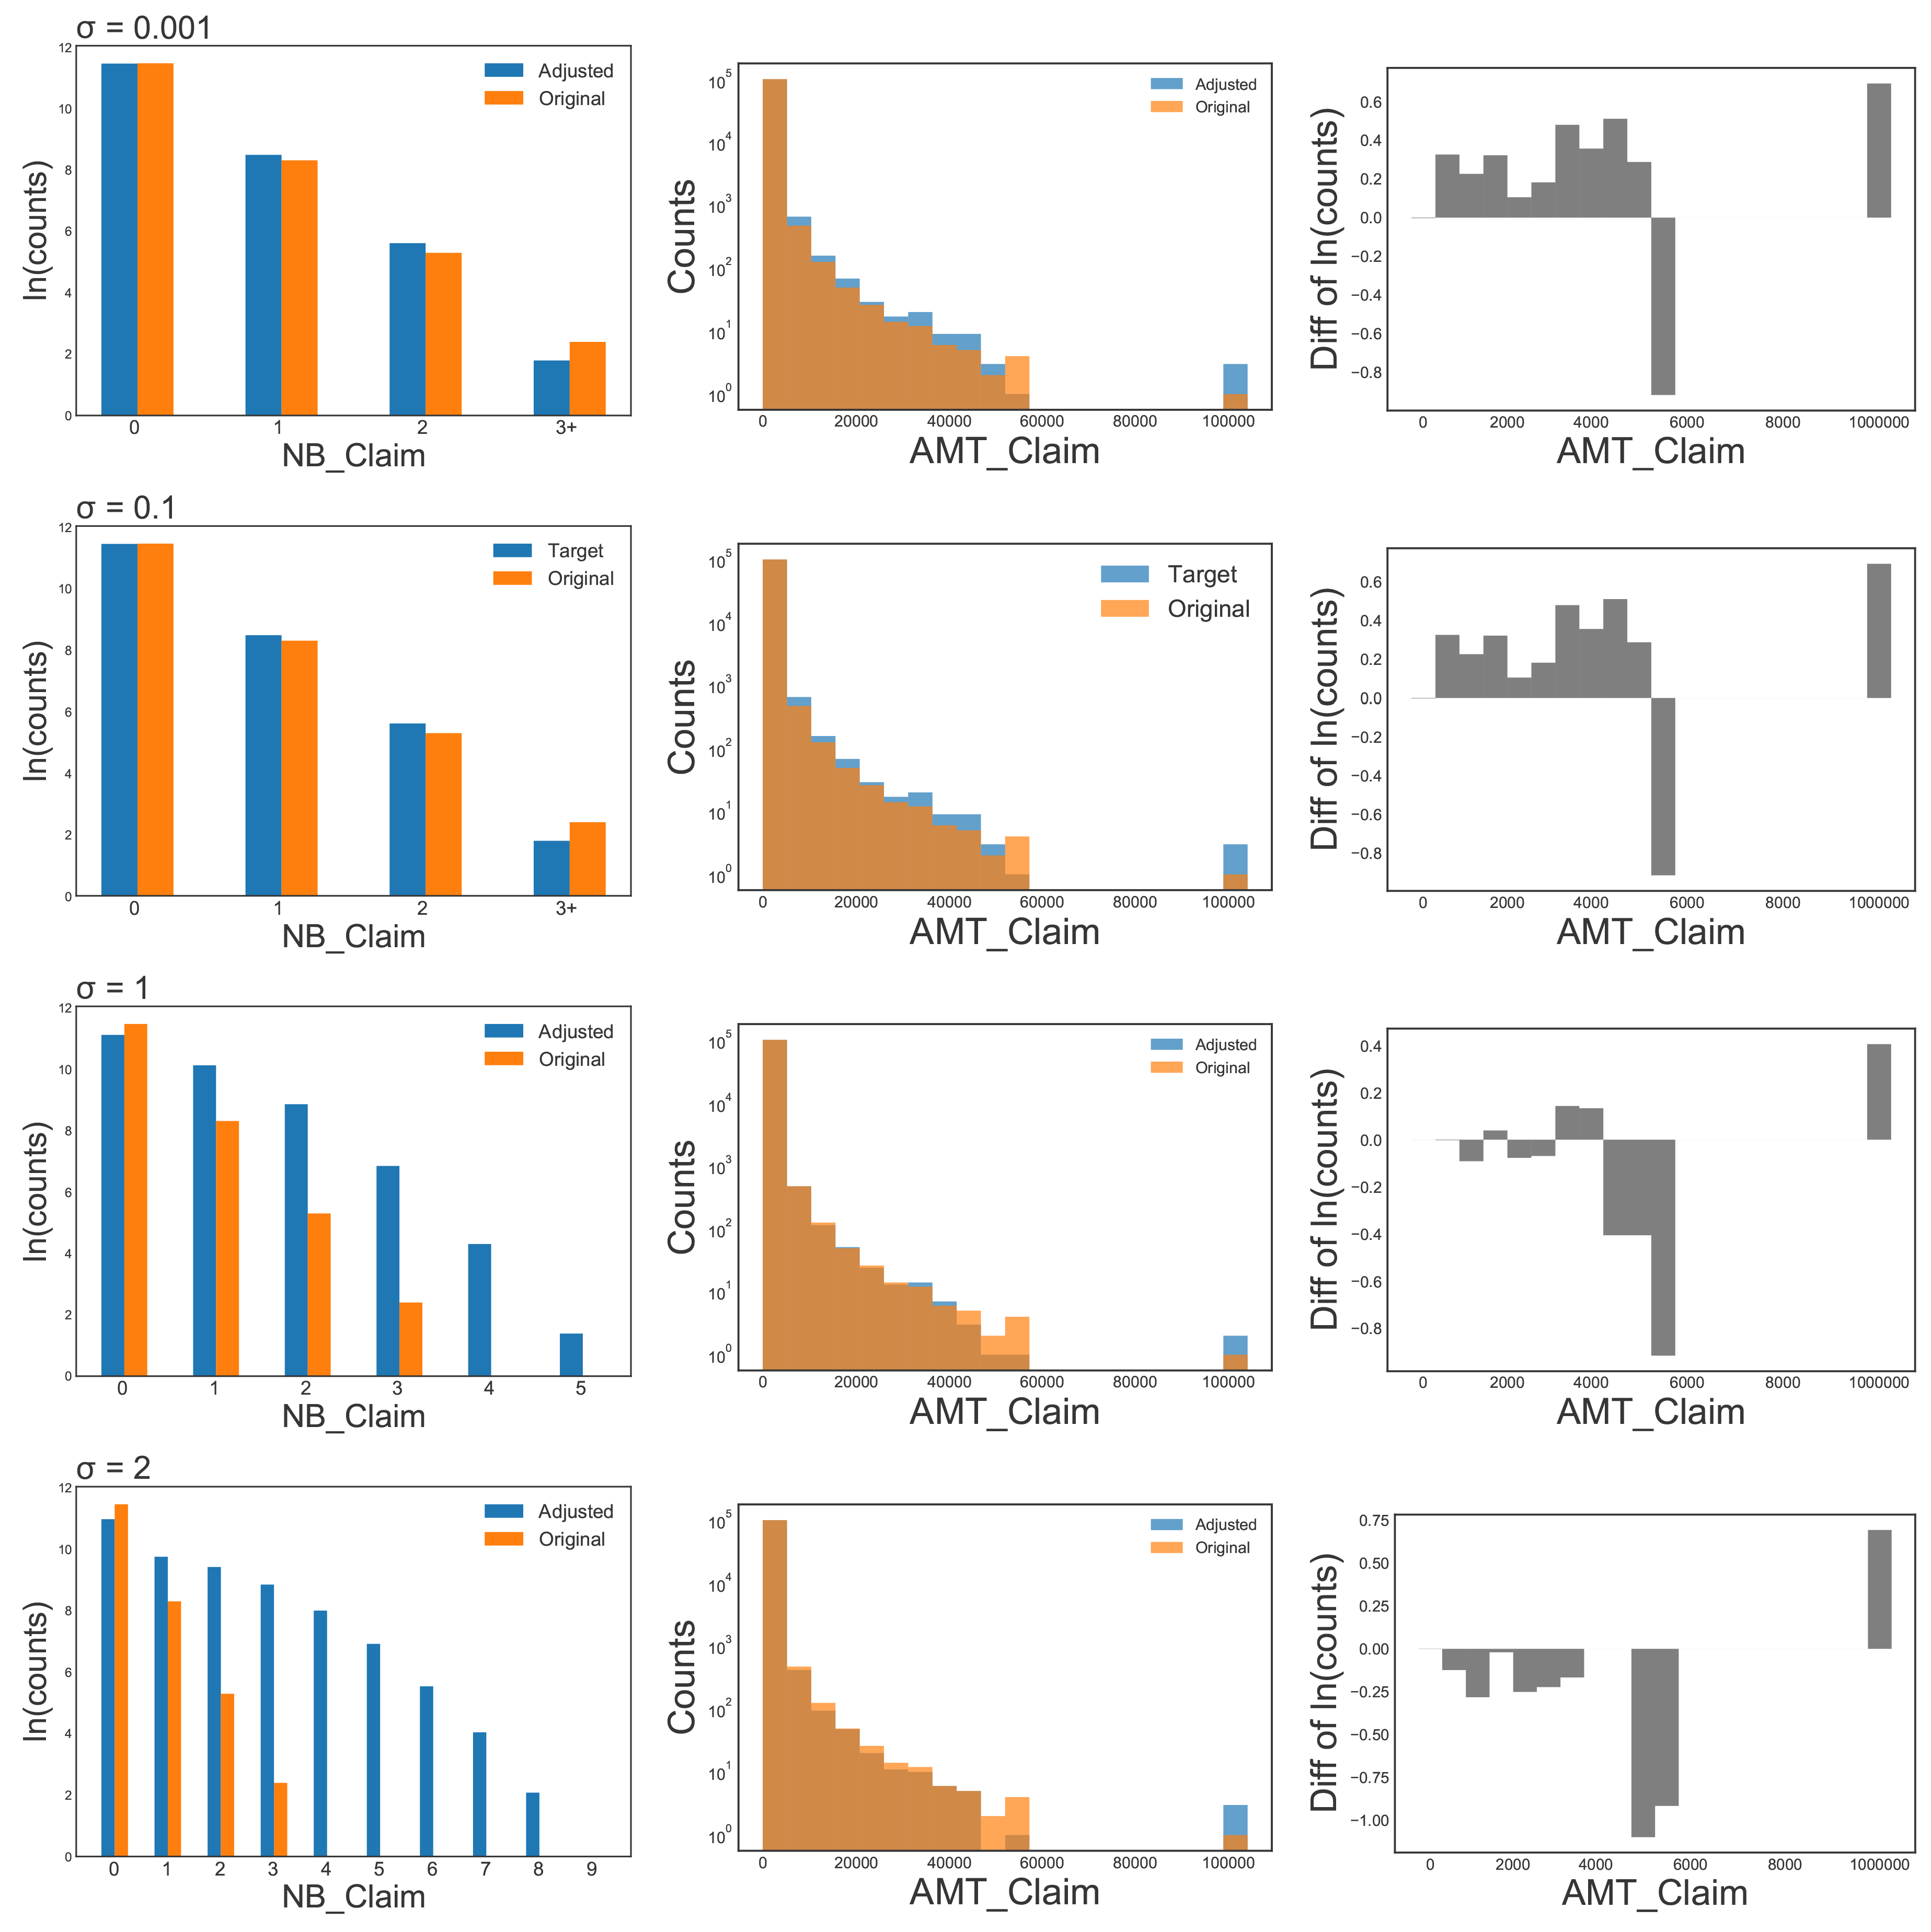
While the target and original ratios are quite close in the benchmark covariates, the other variable distributions are not identical to those of the originals, which distinguishes the generated portfolio from the original. Figure 4 shows that the distributions of the two response variables differ between the generated and original portfolios (NB_Claim, AMT_Claim), where the variability increases as the perturbation input increases.
_and_`amt_claim`_(middle_and_right)_in_target_and_original.png)
Similarly, Figure 4 shows how the distributions of the covariates’ generated values may differ from those of the covariates’ original values. As the level of perturbation increases, the influence of random noise in the generated covariates also increases. For example, in the case of Years.noclaims, the distribution becomes almost uniform when a large perturbation parameter is applied.
5. Concluding remarks
This article explored a new algorithm, SEAT, which allows users to generate insurance claims datasets with telematics features that are tailored to match the policy characteristics of a target market. The proposed algorithm employs both the ratios of selected policyholder characteristics and collinearity of these benchmark covariates in the original data as inputs. This generates a synthetized claims dataset that matches the target market where the resulting dataset is not identical to the original. The proposed simulation engine, SEAT, is also fully accessible to the public and can generate granular datasets with telematics features.
We acknowledge that the proposed algorithm uses the original feature portfolio as the main source; therefore the behavior of the synthetic portfolio is heavily dependent on the source dataset. Nevertheless, this research is meaningful in that it provides a novel method of producing telematics claims datasets with flexibility and accessibility, which encourages both practitioners and researchers to deepen their understanding of telematics data, and provides insight into the potential uses of existing telematics data. Finally, the procedure described in this paper could be expanded to many different types of data in addition to telematics. For instance, it could be applied as an extended version of the Casualty Actuarial Society (2018) CAS loss simulator to simulate data for a claims-level loss reserving model with individual policy characteristics.
Acknowledgments
The authors thank Daesan Shin Yong Ho Memorial Society for financial support through its Insurance Research Grant program.