

1. Introduction
Fraud is a major problem for the insurance industry. Although the true cost of fraud for the industry, and subsequently for insurance policyholders who bear this cost through higher premiums, cannot be known, the FBI estimates the annual cost of fraud to be $40 billion (FBI 2009). Insurance fraud comes in two varieties: hard and soft fraud are the operational terms. Hard fraud applies to claims for fictitious accidents and injuries, while soft fraud denotes the increase of claimed loss through unnecessary and/or inflated values of claimants’ loss costs. The former is criminal and is the purview of the criminal justice system; the latter is generally a civil matter that is the larger of the two in dollar terms and is the purview of the insurers (Derrig 2002).
Insurers can take steps to reduce the amount of fraud, especially soft fraud, but these steps are costly, and these costs have to be weighed against the expected savings. Insurance fraud has been the subject of considerable research from a variety of angles. This paper examines how the number of insurers in the market and how the different laws regarding subrogation in liability claims affect the incentives to investigate, and therefore reduce, fraud.
A number of recent studies have examined claim settlement behavior by insurers as it relates to insurance fraud (Artís, Ayuso, and Guillén 2002; Crocker and Tennyson 2002; Derrig 2002; Derrig and Weisberg 2004; Loughran 2005; Dionne, Giuliano, and Picard 2009). Several studies have utilized a Nash Equilibrium framework (Nash 1951) between insurers and policyholders to examine auditing strategies for fraudulent claiming behavior by policyholders (Boyer 2000, 2004; Shiller 2006). In this paper, a model of insurance company behavior combining the cost of claims, the cost of investigating claims and the potential for reducing claim costs is developed and analyzed in a game theoretic approach in which the other players are insurers, rather than policyholders. The presence of a Nash Equilibrium, in which no player in a simultaneous noncooperative game can unilaterally improve its position by shifting its strategy for investigating claims, is observed under a variety of different market conditions.
For a simple example of a Nash Equilibrium consider Jack and Jill, two very young entrepreneurs operating lemonade stands in front of adjacent houses. They have an unlimited supply of their product from their parents’ kitchen at no cost (to Jack and Jill) and they consider the time they spend staffing their stands to be fun, so there are no labor costs involved. They know the thirst level and financial position of each of their potential customers, so they can determine how the demand for lemonade is affected by the price. Both sellers and buyers can see what each competitor is charging, and buyers will get their lemonade from the lower cost seller, so the market is fully competitive. The battle of the sexes, junior edition, prevents the sellers from pricing their product cooperatively, so this is a classic noncooperative game to which Nash’s work applies. The sellers’ decision is whether to charge 1¢ or 2¢ per cup. Demand is such that 10 cups will be sold if the price is 1¢, but only 8 cups will be sold if the price is 2¢. All sales will be made by the lemonade stand charging the lower price. If both stands charge the same price, each will get 1/2 of the sales.
Game theory often utilizes payoff matricies to illustrate the results from different strategies. In the payoff matrix below, and the subsequent ones in this paper, the choices of one competitor are shown along the top of the matrix and the choices of the other along the left side. To determine the payoff from a particular strategy for the top competitor, look at the column representing their choice and move down to the row representing its competitor’s choice. The top-right half of the appropriate box is the payoff to the competitor listed along the top, and the bottom-left half of that box shows the payoff to the competitor listed along the side.
The payoff matrix that illustrates the lemonade pricing decision facing Jack and Jill is shown in Table 1.
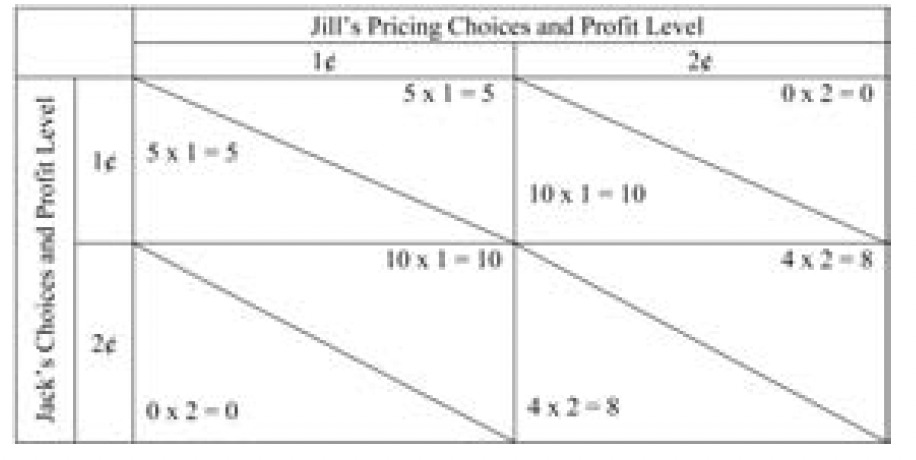
If both children charge 2¢ per cup, each will sell 4 cups of lemonade (half of the total demand) and earn a profit of 8¢. However, this is not a Nash Equilibrium since if either Jack or Jill (but not both) lowered the price to 1¢, that child would sell 10 cups and earn a total profit of 10¢. In this example, the situation where each child charges 1¢ a cup is a Nash Equilibrium, because neither child can unilaterally change the price and earn a higher profit. By raising the price alone to 2¢ a cup, they would not sell any lemonade and their total profit would be 0. For a more complete description of game theory economics[1] and Nash Equilibrium, see chapter 6 of Miller (2003). In most insurance cases, the Nash Equilibrium is not at the globally optimal claim investigation strategy.
Claims presented to an insurance company for payment may include a variety of different components. One component is a valid expense that should be paid in full by the insurer, since both the amount is appropriate and the coverage is applicable. Another component could be an excessive charge on a claim that would otherwise be covered. A charge is considered excessive if it is judged by the insurer to be “unreasonable”; most insurance policies cover only “reasonable” charges with reasonability defined by context and ultimately determined by negotiation, arbitration or, if necessary, a court. A third component could be a claim for a service that is not covered although other services would be covered. A final component could be for an incident that is not covered in its entirety by the insurance policy. Sorting out the different components of a claim efficiently is a constant process within a claims department.
For automobile insurance coverage in the United States, bodily injury claims can consist of two different insurance coverages. Medical expenses incurred by the policyholder or anyone else insured under the policy (family members, anyone occupying the covered vehicle) as the result of an automobile accident are covered, subject to policy limits, by the insurance company providing medical payments (MedPay) or personal injury protection (PIP) coverage without regard to fault.[2] If someone is injured as the result of the fault of another person, then that injured party could pursue a liability claim against the responsible party, depending on the tort threshold applicable under the policy (IRC 2003, chapter 2, 2004a, 2004b)(2004b). The insurance company of the responsible party would be liable for the damages incurred by the injured person, subject to policy limits and degree of fault, under the liability insurance policy. Bodily injury liability damages consist of such tangible expenses as medical expenses and loss of income, which are termed special damages, and intangible components such as pain-and-suffering, loss of consortium or hedonic damages, which are termed general damages.[3] The insurer that paid the medical expenses under the medical payments or PIP policy may also be able to recoup its payments from the liability insurer under subrogation. Simon (1989) examined rules for allocating loss adjustment expenses between primary insurers and reinsurers when subrogation was involved. Similar complexities are generated for insurers when determining the cost of claim investigation when two policies are involved.
In some cases the same insurer is responsible for both the medical expenses and the bodily injury liability payment. This would occur when the driver is responsible for an injury to a passenger, or if the same insurer covered the injured person under medical payments coverage and the responsible party under a different liability insurance policy. When a single insurer is responsible for all payments, determining the appropriate level of fraud investigation considers the entire cost of all claims.
2. Claim investigation for injury claims
Several types of claim investigation are commonly used by automobile insurers in addition to the routine gathering and evaluation of the circumstances of the accident and the cost of the treatment for the injury. The most common method is an Independent Medical Examination (IME), in which a doctor selected by the insurer examines the injured claimant and develops an independent assessment of the injury and the appropriate treatment. If the IME indicates a more moderate level of injury or treatment than the claimant has reported through his or her medical care provider, then the claims department has a stronger case for denying some or all of the medical expenses that have been, or are likely to be, submitted. Another type of investigation is a Medical Audit (MA), in which the medical expenses are reviewed by a specialist or an expert system. Unusual factors that appear in the medical audit may provide the claims department with justification to reduce the claim payment. A third alternative is to refer the claim to a Special Investigation Unit (SIU), where specifically trained personnel are assigned to investigate claims with unusual questions in order to determine whether, and how much of, the claim should be paid.[4] Derrig and Francis (2008) examined a collection of objective factors in a predictive model for referring Massachusetts auto injury claims for an IME or a special investigation for fraud, along with the likelihood of success at reducing the claim amount. Such predictive models should allow for more efficient, i.e., less costly by reducing false positives, selection of claims to investigate.
IMEs and MAs can be used to reduce the amount of claim payments for medical expenses. SIUs can also reduce these expenses, but can also impact other expenses or even determine if the claim is valid at all. One level of investigation would be to investigate each claim for which the expected savings from the investigation exceed the cost of the investigation. We call that approach “tactically optimal.” Another level of investigation would vary according to the characteristics of the claim so that the savings net of costs for the entire portfolio of claims is optimal in some way. We call this approach “strategically optimal.” In order to measure the expected savings, the insurer needs to ascertain the chance of finding unreasonable or fraudulent activity and the potential savings if that activity is discovered. We now turn to a formalization of the cost/ savings process when total claim payments consist of first party PIP and, when applicable, third party liability.[5]
3. Savings versus cost
The following notation will be used:
Cost of claim without any investigation:
PIP claim = P
Liability claim (excess of PIP) = L
Total Compensation = P + L
Subscripts on P and L:
First subscript indicates company responsible for PIP
Second subscript indicates company responsible for Liability (0 if no liability)
P1,0 represents a PIP claim where company 1 has the PIP coverage and there is no liability claim
P1,1 represents a PIP claim where company 1 has the PIP coverage and the liability coverage
P1,2 represents a PIP claim where company 1 has the PIP coverage and company 2 has the liability coverage
P1,· represents the sum of all PIP claims where company 1 has the PIP coverage
L1,1 represents a liability claim where company 1 has the PIP coverage and the liability coverage
L2,1 represents a liability claim where company 2 has the PIP coverage and company 1 has the liability coverage
L·,1 represents the sum of all liability claims where company 1 has the liability coverage
Savings from investigations:
Savings on PIP claims = SP
Savings on Liability claims = SL
Savings on Total claim = ST = SP + SL
Level of investigation:
No investigation = 0
Optimal investigation based upon information on first party claims = A
Optimal investigation based upon information on both first party and liability claims = B
Subscripts on SPA, SPB, SLA and SLB:
First subscript indicates company responsible for PIP
Second subscript indicates company responsible for Liability (0 if no liability claims)
SPA1,0 represents the savings on PIP claims from an A level investigation where company 1 has the PIP coverage and there is no liability claim
SPA1,1 represents the savings on PIP claims from an A level investigation where company 1 has the PIP coverage and the liability coverage
SLA2,1 represents the savings on liability claims from an A level investigation where company 2 has the PIP coverage and company 1 has the liability coverage
Investigation cost:
Cost of an A level investigation = IA
Cost of an B level investigation = IB
Subscripts on IA and IB:
First subscript indicates company responsible for PIP
Second subscript indicates company responsible for Liability (0 if no liability claims)
IA1,0 represents the cost of an A level investigation where company 1 has the PIP coverage and there is no liability claim
IA1,1 represents the cost of an A level investigation where company 1 has the PIP coverage and the liability coverage
IA1,2 represents the cost of an A level investigation where company 1 has the PIP coverage and company 2 has the liability coverage
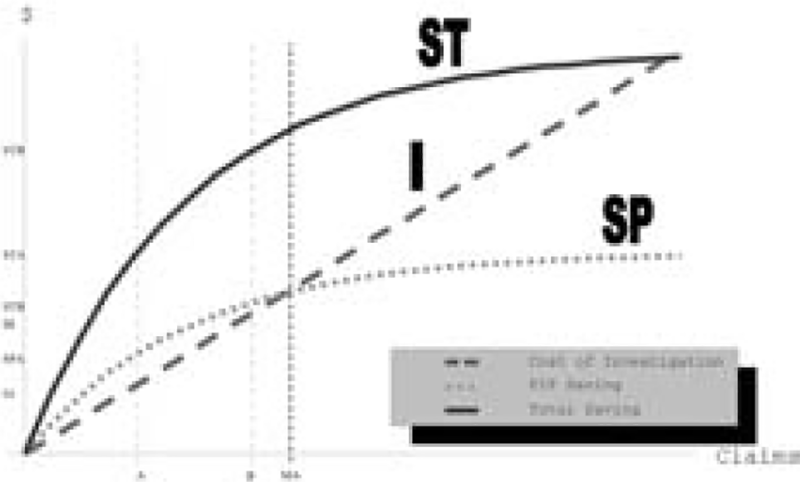
The relationships between the cost of investigation and expected savings, as well as the determination of the optimal levels of investigation under different circumstances, are illustrated in Figure 1. The x axis represents the number of claims. The y axis indicates dollar values. The claims are ordered in decreasing size of expected savings from claim investigations. The use of ex-ante expectations of savings from investigation is important and differs strongly from the ex-post ordering of claims with savings from investigation. In practice, actual investigations will be taken from a random or targeted draw of claims that yield the largest expected savings. The cost of investigations (I) function is a straight line under the assumption that each investigation has the same expected cost.[6] Two concave functions represent the expected savings from an investigation. The lower curve, labeled SP, represents the savings on first party claims and the higher curve, labeled ST, represents the savings on the total claim including both PIP and Liability payments. Both SP and ST have positive slopes and negative curvature. A point will be reached where all the remaining claims are expected to be completely valid, so no additional savings are achieved by additional investigation.
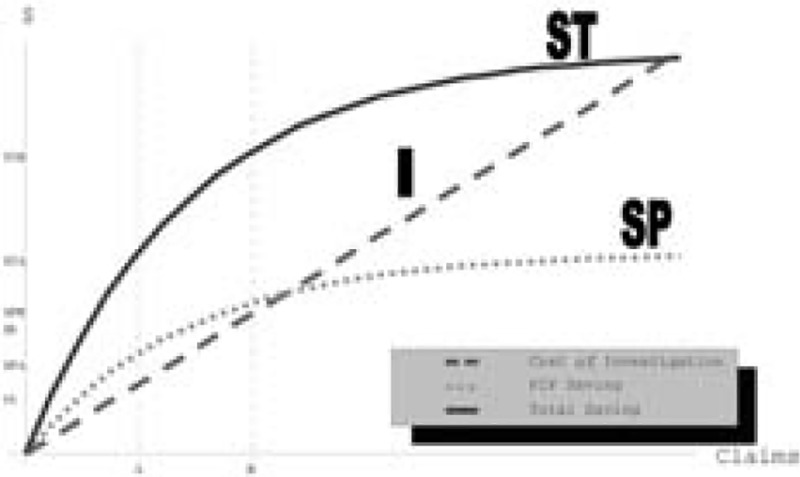
The optimal level of investigation is determined when the slopes of the cost of investigation line and the savings are equal. The tactically optimal number of claims to investigate, based on information in first party claims, is A. At this point, SP − I is maximized. The cost of this investigation is IA, the savings on first party claims is SPA, and the savings on total claims is STA = SPA + SLA.[7] The strategically optimal number of first party claims to investigate, based on total claim savings is B, an amount in excess of A.
Some of the relationships that develop from this approach are:
SPB>SPAIB>IASPA>IASTB>IBSPB−SPA<IB−IA.
4. Single insurer case
When a single insurer writes the entire automobile insurance market, this company will be responsible for paying both the PIP expenses and the liability award resulting from every automobile accident. In this case, the company can weigh the potential cost savings on the total claim against the cost of this investigation. The tactically optimal level of investigation would be to investigate all claims where the expected savings from the investigation exceed the cost of the investigation. This is the situation we will consider first.
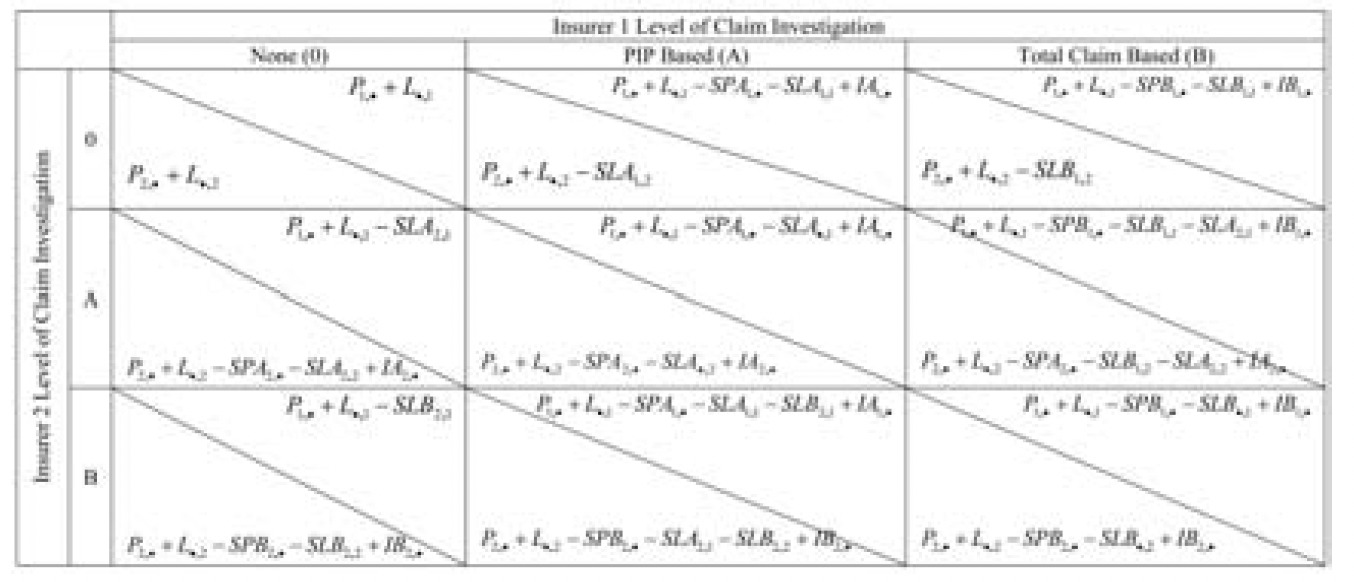
The three choices a single insurer faces regarding the level of claim investigation are displayed in Table 2. The insurer can perform no investigations and simply pay the amount claimed. This situation is displayed in the first box. Alternatively, the insurer can investigate A claims. The additional cost is IA1,0 + IA1,1 and the associated savings are SPA1,0 + SPA1,1 + SLA1,1. Since the savings on the PIP claims alone, SPA1,0 + SPA1,1 exceed the cost of the investigations, the insurer would prefer this option over the case of no investigations. The third choice, though, where the insurer investigates B claims, is the optimal choice. The cost of this additional investigation is IB − IA. The additional savings are SPB + SLB − SPA − SLA. Since the slope of the Total Savings curve exceeds the slope of the cost of investigations curve over the range from A to B, then the savings exceed the costs, and the insurer would minimize net claim costs by investigating B claims.
This strategy will have the benefit of reducing the cost of unreasonable medical treatment to the lowest feasible level considering the cost to investigate claims. This strategy also reduces liability awards and the cost of automobile insurance to the lowest level feasible given the cost of investigating these claims and the ability to lower awards through negotiation (Derrig and Weisberg 2004). Additional reductions in claims costs could be obtained, but the additional investigation expenses would exceed the claim cost savings, so insurance premiums would actually increase. The other expenses of the insurer, including underwriting expenses and normal loss adjustment expenses (other than investigating for fraud), are not included in this analysis, since they will be the same regardless of the level of investigation for claims fraud.
5. Two insurer case: No subrogation
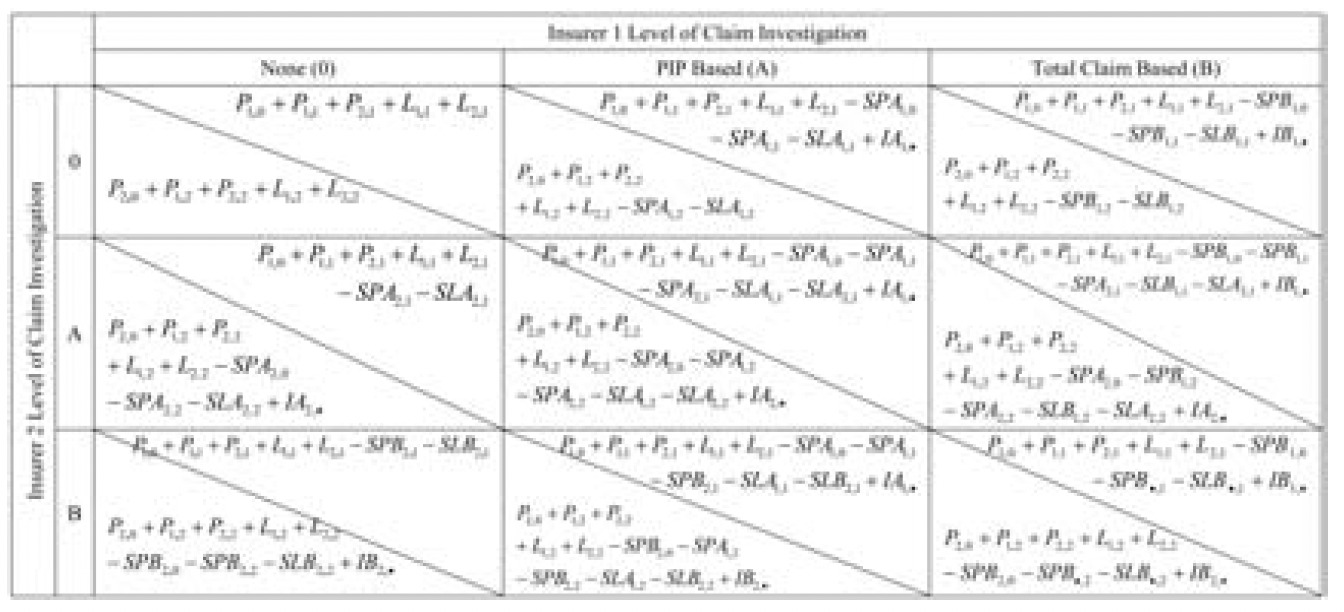
Assume the market consists of two competing insurers of equal size, with similar claim distributions (the SP and ST curves are the same for each insurer). Assume the claim settlement system does not permit the recovery of the PIP claim payment and adjustment expense from any at-fault party through subrogation.[8] Then they would each face a decision about the appropriate level of investigation of claims fraud, but their net claim costs would depend both on their own investigation level decision and the decision of their competitor. The outcomes, in the case where there is no subrogation, are shown on Table 3. The upper segment of each cell denotes the position of insurer 1; the lower segment that of insurer 2.

If both insurers were to investigate optimally based on aggregate claim costs, then each insurer would bear the cost of investigating B claims, and benefit from the savings in claim costs on both PIP and Liability claims. This situation is represented in cell (B, B) and resembles the optimal position for the single insurer case. Unreasonable medical expenses are reduced to the lowest economically efficient level, liability costs are minimized, and the total cost of auto insurance is kept at the lowest level.[9]
However, this is not a stable situation. Insurer 1 might be better off if it only investigated claims at the A level, which would lower its cost of investigations by (IB − IA), and only increase claim costs by (SPB1,· − SPA1,· + SLB1,1 − SLA1,1). If insurer 2 were to continue to investigate claims at the B level, then insurer 1 would benefit on its liability claims for which insurer 2 had the PIP coverage (SLB2,1). For the two insurer example, the lower investigation costs may or may not exceed the savings. Although (IB − IA) > (SPB1,· − SPA1,·), whether it also exceeds (SPB1,· − SPA1,· + SLB1,1 − SLA1,1) depends on the relationship between the SP and ST curves and the cost of the claims where insurer 1 has both PIP and Liability. The cost savings on liability claims must be included in the decision of which level of investigation to pursue. However, if it is advantageous for insurer 1 to move to a lower level of investigation, then it would also benefit insurer 2 to move to that level, so the resulting position would be that displayed in cell (A, A).
If the insurers move to cell (A, A), that will prove to be a Nash Equilibrium. Neither insurer can move unilaterally to another position that benefits itself. Insurer 1 will not stop investigating claims at the A level and move to the no investigation level. If it were to do so, the savings would be IA and the cost would be SPA1,· +SLA1,1. Since IA < SPA alone, this change would increase the net cost of claims. Although the overall optimal position would be cell (B, B), that is not a stable equilibrium since one company might benefit by reducing the level of investigations.
Table 4 describes the conditions that lead to each claim investigation strategy for the insurers. Cell (B, B) is a Nash Equilibrium if IB1,· − IA1,· < SPB1,· − SPA1,· + SLB1,1 − SLA1,1. Since both insurers are assumed to be the same size and have the same distribution of claims and costs, then if this relationship holds for insurer 1, it should also apply to insurer 2. This equilibrium would apply if the cost savings for each insurer on claims where it had both the PIP and the liability coverage exceeded the additional cost of investigating claims at the B level. Each insurer would not be assured of receiving the savings of a B level investigation on its liability claims where the other insurer has the PIP claim, since that insurer might elect a lower level of investigation. Alternatively, cell (A, A) would be the Nash Equilibrium if IB1,· − IA1,· > SPB1,· − SPA1,· + SLB1,1 − SLA1,1 and IA1,· < SPA1,· + SLA1,1. Since SPA1,· > IA1,· by itself, then cell (0, 0) will never be the Nash Equilibrium if there is no subrogation. Note also that the off-diagonal investigation levels in Table 4 exhibit elements of the free rider problem; namely, one insurer reaps the liability benefit of the higher PIP investigation level of the other insurer without the additional cost.
In this paper, we assume that insurers follow the same approach for determining the level of investigation for all claims, regardless of whether they are providing the liability coverage or a competitor is providing this coverage. There are several reasons for this assumption. The most important reason is that asking claims personnel to follow different approaches for PIP claims depending on which insurer will bear the liability costs would significantly complicate and potentially delay the claims process. PIP claims develop quickly and must be covered regardless of fault, so PIP claim files may not contain enough information to determine whether liability coverage will apply and, if it does apply, which insurer will provide this coverage. Decisions about how to investigate potential fraud cannot be delayed until all the information is available, or it could be too late to reduce total economic loss. Having a single process in place allows for a more effective decision-making process. There are also some cases in which it is unknown which insurer will ultimately be held liable, such as when a passenger is injured in a two car accident and it is not known which driver will be held liable until the claim is finally settled. Another reason is that insurers know the levels of investigation that other insurers adopt, through subrogation cases and through hiring each other’s former employees. If an insurer followed a suboptimal claim investigation process that put other insurers at a disadvantage, it could trigger retaliation. Finally, regulators may object, and even fine, a company if the claims department had a policy of knowingly under investigating fraud in cases where the BI liability lies with another carrier. Some regulators have already disallowed a portion of rate requests based on assumed inadequate fraud investigation; if a company had a specific policy in place not to investigate claims where savings are expected to exceed the costs, this approach could provide a strong case for this type of regulatory reaction.
6. Two insurer case: Subrogation
This situation differs from the no subrogation case in several ways.[10] First, each Liability insurer is responsible for paying the PIP or MedPay claims of the other insurer when liability attaches and the PIP or MedPay insurer and the Liability insurer are different (Pi,j where i ≠ j). One possible situation is to allow subrogation for the claim, but not for loss adjustment expense. The rationale for this approach is that claim payments are more easily verifiable than loss adjustment expenses. In the case that only claim payments are subrogated, if insurer 1 investigates claims at the A level but insurer 2 does not investigate, insurer 1 does not benefit from the savings on the PIP claims where insurer 2 has the PIP claim but insurer 1 has the liability (SPA2,1). Insurer 2 benefits from the savings on PIP claims, however, where insurer 1 has the PIP claim and insurer 2 has the liability (SPA1,2).[11] Thus, the free rider problem may be more severe when subrogation is considered. In this situation, the Nash Equilibrium could be no claims investigation, since the insurer bears the cost of investigating its own PIP claims, but benefits only on those claims where there is no liability or if the same company has the liability coverage, unless the other insurer investigates all its own PIP claims. The outcomes, given this approach to subrogation, are shown in Table 5.

Table 6 describes the conditions that lead to each claim investigation strategy for the two insurers when subrogation is introduced. In this case, cell (0, 0) may be a Nash Equilibrium, since each insurer only saves money on claims where there either is no liability or it has the liability claim as well. Insurers no longer save money on PIP claims if another insurer has the liability, since those payments would be reimbursed under subrogation. Thus, subrogation introduces a disincentive to investigating claims for fraud unless the cost of investigation is also subject to the subrogation recovery.
An alternative approach to subrogation would be to allow subrogation for both the claim payment and any allocated loss adjustment expense, which would include IMEs and MAs, but not SIU costs which are internal. In this approach, the insurer responsible for paying subrogation would have to trust, or be able to audit, the coding of allocated loss adjustment expenses by the other insurer to assure that the investigation costs do apply to the appropriate claim. Subrogation of allocated claim expense increases the incentive to investigate PIP claims since the (allocated) costs to investigate PIP claims would be reimbursed if another insurer has the liability coverage. In this case, if one insurer conducted an IME that results in cost savings for a second insurer, the second insurer would have reimbursed the first insurer for the cost of the IME.
A third approach would be to allow subrogation for unallocated loss adjustment expenses as well as allocated loss adjustment expenses.[12] Unallocated LAE (ULAE) are the claim expenses that cannot be assigned to a particular claim, which would consist of the cost of running a company’s claim department, including salaries, supplies and office expenses. In Massachusetts, where this approach to subrogation is applied, ULAE is calculated as 10 percent of the claim cost. If a claim adjuster is considering investigating a claim in which the expected savings will exceed the cost of the investigation, but another company is likely to be liable for the loss, the insurer is saving the other insurer money and reducing its ULAE reimbursement. For example, assume that a claim on which one insurer had the PIP coverage and the other insurer had the liability coverage generated $2200 in claimed medical expenses. The PIP insurer could request an IME that is expected to cost $300 and that would reduce the medical expenses by $800, to $1400. The PIP insurer may not do this investigation under a tactically optimal strategy. If the claim were to qualify for subrogation, then the reimbursement for ULAE declines from $220 (10 percent of $2200) to $140 (10 percent of $1400) even though the claim department puts in additional effort to request and review the IME and then negotiate with the claimant to reduce the claim payment. On the other hand, under a strategically optimal strategy, the PIP insurer may well investigate reimbursable PIP claims to reinforce a “hard-line” attitude on unreasonable medical charges in order to maximize savings on its own claims.
Subrogation rules can have a significant effect on the incentives for investigating claims. Table 7 summarizes the different subrogation regulations by state, and also indicates the type of compensation system in effect in each state. In some states, including California and Florida, no subrogation is allowed for either Medical Payments or PIP. In other states, both Medical Payments and PIP are eligible for subrogation. Most states allow subrogation for either Medical Payments or PIP, but not both. Massachusetts allows subrogation of PIP claims but not Medical Payments excess of PIP.
7.1. Multiple insurer case
A more realistic situation arises where there are many insurers in the market. Some insurers may write a major share of the market within an individual state, in a few cases in excess of 30 percent. However, in most states a large number of insurers compete and the market share of most companies represents only a small share of the market. Thus, it is relatively rare that the same insurer provides PIP coverage under one policy involved in a claim and liability coverage under another policy by covering both cars involved in a two car accident.[13] In this situation, the Nash Equilibrium position is even more likely to be the No Investigation level, since most of the benefits of the investigations will accrue to other insurers. The simple relationships for a market with multiple insurers and subrogation are described in Table 8.
7.2. Example
The decision process facing each insurer can be illustrated by an example. A PIP claimant is visiting a physical therapist for treatment. The current cost of the claim is $2000 for medical expenses. Another driver is expected to be held liable for the accident. Based on past experience for that type of injury with that physical therapist, the PIP insurer expects the total claim for medical treatment will be $2200. If the PIP insurer orders an IME, which costs $300, the insurer expects to be able to determine that no additional physical therapy is needed, limiting medical expenses to $2000. The liability award for noneconomic losses (pain and suffering) is expected to be $4000 if no additional treatment is received, but $4360 if additional treatment is provided. Assume that the liability insurer is not in a position to undertake this investigation and reduce its costs because at the time a determination of liability is made the full treatment of physical therapy has been be completed.[14]
The cost of the IME, $300, exceeds the PIP savings of $200 on this claim, but is less than the total of the PIP and liability savings ($560). In the single insurer case, the insurer will request an IME on this claim and curtail the additional costs. In the two-insurer case, if there is no subrogation, the PIP insurer spends $300, saves $200 on the PIP, and has a 50% chance of saving $360 more on the liability claim (with only two insurers, the PIP insurer has a 1 in 2 chance of writing the responsible party’s liability insurance in simple two-car collisions). Therefore, the PIP insurer would also request the IME on this claim. In the two-insurer case where there is subrogation, the PIP insurer faces a 50% chance of saving on the PIP claim and on the noneconomic losses (if it also has the liability), so the expected savings would be $280 (half of the $560 total savings). Thus, the PIP insurer would not investigate this claim unless the allocated LAE is reimbursable. If LAE is not reimbursable, the cost of investigating the claim is $300. If LAE is reimbursable, then the expected cost of the IME is reduced to $150, which would encourage the PIP insurer to undertake this investigation in order to save an expected value of $280. If unallocated LAE is covered by subrogation as a percentage of the PIP claim, the insurer would be slightly less inclined to perform this investigation, as it would reduce the PIP payment by $200, and the reimbursement from the other carrier by one-half of the ULAE subrogation rate times $200 (one-half since there is an equal chance that each insurer will be the one responsible for the liability). In Massachusetts, where the unallocated LAE reimbursement rate is 10% of a PIP claim, this would reduce the value of investigating this claim by $10 (.5 × 10% × 200).
In the multiple insurer case, the PIP insurer will have a lower chance of providing the liability coverage on this claim. In this example, with no subrogation, if the chance of covering both the PIP and liability is less than 28%, then the expected savings on the noneconomic losses would not be enough to compensate the PIP insurer to undertake this investigation. (The cost of the investigation is $300, the savings on the PIP are $200, and the expected savings on the liability would be 28% of $360.) If there is subrogation of losses, but not of LAE, then the PIP insurer would never investigate this claim unless the chance of covering both PIP and liability is greater than 54% (300/560), as the expected savings would be the market share times $560 and the cost of investigating would be $300. If allocated LAE is also covered under subrogation, then the PIP insurer would have the incentive to investigate this claim, as the expected savings would be the chance of having both PIP and liability times $560 and the expected cost of investigating would be that chance times $300. As long as the total expected savings exceeds the expected cost of the investigation, the PIP insurer should perform the investigation. However, reimbursement of unallocated LAE can change the decision again. For example, if the chance of covering both PIP and liability is only 5%, then the expected savings from this investigation is $13 (5% × (560 − 300)), while the reduction in expected ULAE reimbursement is $19 (95% × 10% × $200).
Thus, the incentive for insurers to be strategically optimal is much lower when a large number of insurers compete. There is more room for some insurers to exploit a free rider problem when more than two insurers are involved in splitting the costs and benefits of adjusting claims. This would be one disadvantage of having a hybrid no-fault-limited tort system rather than a simple tort or no-fault system of compensation.[15]
8. Alternative arrangements
Incentives to underinvestigate claims can be addressed in several ways. If the claim investigation strategy is viewed as a repeated game, with each insurer monitoring the performance of the other insurers for free riding and adapting their own behavior based on what other insurers are doing, then rules can be established to provide incentives to investigate claims more fully to the mutual benefit of all, leading to the optimal (B, B) equilibrium. The prior strategy described in this paper assumes that insurers make only one choice of investigation after considering the expected costs and savings. Alternatively, insurers can switch levels of investigation depending on the behavior of the other insurer, making this situation a repeated, noncooperative game. In this situation, negotiation and monitoring might be able to move the equilibrium position back to cell (B, B). Liability insurers will know, when paying the claim to the injured person and the subrogation costs to the other insurer, whether the claim has been investigated fully, especially if ALAE is covered under subrogation. If a company is not investigating an appropriate proportion of claims (each insurer would know this, since the optimal level of investigation is assumed to be the same among all insurers), other insurers could retaliate against the offending insurer by treating that company’s PIP claims differently For example, they might be less cooperative when determining subrogation payments or provoke regulatory oversight. Therefore, competing insurers could investigate claims at the strategically optimal level in order to reduce claim costs, and premiums, to the lowest feasible level and then monitor competitors to make sure they are living up to this standard. However, in the case of an insurer that expects to become insolvent in the near future, there is no expectation of the repeated game. Such an insurer may revert to no investigation for at least those claims with savings accruing to other insurers without fear of future retaliation.[16] Thus, observing an insurer’s claim investigation pattern could also prove to be an early warning sign of financial problems.
A second approach to addressing the underinvestigation problem would be to develop a system under which the claim investigation costs are shared among all insurers. This approach is similar to that recommended by Picard (1996) for dealing with claim audit costs. One possible approach would be to handle claim investigations in a manner similar to a reinsurance pool, where bills are submitted to the pool and any market share adjustments necessary are made at the pool level. Each company is required to pay a proportionate cost of claim investigations, based on market share, regardless of its own investigation strategy. This strategy may introduce increased overall system costs above those of the market monitoring strategy and, thereby, be less efficient. Another (partial) method of doing this would be to establish a separate fraud investigation unit, with the costs shared by all insurers, to decides which claims to investigate based on the total cost savings impact, regardless of which insurer would benefit from these savings.[17]
8.1. Empirical evidence
There is evidence in Massachusetts auto injury claims that insurers follow the strategy of using independent medical examinations (IMEs) to investigate claims at least to the extent that they derive (1) positive savings net of investigation costs overall and (2) no net loss on PIP investigations (Derrig and Weisberg 2003). Massachusetts is a no-fault state, with all auto insurance companies required to offer first-party PIP coverage to policyholders. This coverage provides up to $8000 of coverage for economic losses such as medical expenses, loss of income, compensation for loss of services, and other expenses related to an injury caused by an automobile accident. These can be the bulk of the expenses that typically serve as the special damages in a tort claim, the remainder being general damages or pain and suffering. There is also a $2000 medical expense tort threshold for liability claims in Massachusetts.[18] This threshold can be met by eligible medical expenses including ambulance, hospital, physician, chiropractor, or physical therapy bills. An injured person can only recover noneconomic losses if the accident is the fault of another party and medical expenses exceed $2000. Since medical expenses are covered by the PIP insurance, there is an incentive for a claimant to incur at least this amount in medical bills (Weisberg, Derrig, and Chen 1994).
If the PIP insurer can contain the medical expenses below $2000, not only will the PIP claim be lower but lower (or no) payments will be made for any noneconomic losses. Even if medical expenses exceed the threshold, limiting the total claimed medical expenses can have an additional impact on the liability claim, since the noneconomic losses included in liability settlements tend to be directly related to claimed medical expenses. Although demonstrating that the total liability settlement is not simply a multiple of the medical expenses, Derrig and Weisberg (2004) and Loughran (2005) found that the settlements for noneconomic losses do increase with the cost of the medical expenses incurred but are reduced in other circumstances (such as high suspicion of fraud or positive findings from a BI IME) by negotiation. Thus, any impact the PIP insurer can have to restrain medical expenses will have an additional cost savings on the noneconomic losses and level B investigation may raise the return to investigation for all insurers.
8.2. Massachusetts independent medical examinations
The Automobile Insurers Bureau of Massachusetts conducted a study of three data sets of claims involving IMEs, the primary tool used by insurers to control auto injury costs (Derrig and Weisberg 2003), that we summarize here. The methodology is a “tabular” analysis that simply compares the mean payments for four subgroups of claims:
-
IME not requested
-
IME requested but not completed (no-show)
-
IME completed and positive outcome (positive IME)
-
IME completed and negative outcome (negative IME)
The estimated gross savings for each of the first three subgroups above is the difference between the average payment for that category and the average for the last subgroup (completed with a negative outcome). An average IME cost is then subtracted to obtain an estimate of net savings. The following results are taken from the AIB Derrig and Weisberg (2003) report.
Table 9 displays the results for the three sets of tabular analyses:
-
1993 AIB sample (claims from a prior AIB study)
-
1996 DCD sample (claims from AY 1996 in the AIB detailed claim database of all auto injury claims[19])
-
1996 CSE sample (claims from AY 1996 in the claim screen experiment[20])
Results are shown for both the PIP payment and for the total payment (PIP + BI). The results suggest that IMEs as currently employed represented roughly a break-even proposition on PIP, although for the CSE sample the cost of IMEs slightly outweighed their benefit.
The bottom half, however, tells a different story. Here the overall net savings for BI and PIP payments are combined. These savings are based on the outcome for the “best” IME, whether carried out on the PIP or BI claim. The average gross savings for the CSE sample was 9.2%, with a net savings of 8.7%. Nearly half of the gross savings (4.3%) is attributable to IMEs requested but not actually completed. That is, the claimant fails to show for the exam. In that case, savings can result either if a potential BI claim is never made, or if the BI settlement is reduced through negotiation.
Somewhat more than half (4.9%) results from a positive IME outcome (reduction of medical expenses or curtailment of medical treatment) on the PIP or BI IME. In the case of a BI IME or a PIP IME used in the BI settlement, it may be too late to have a meaningful impact on any ongoing treatment. However, evidence of excess treatment uncovered during the IME may provide leverage to the adjuster in negotiating a lower settlement by eliminating those medicals from any proposed settlement.
Figure 2 illustrates the placement of the Massachusetts IME investigations relative to the theoretically optimal levels of Figure 1. PIP savings equal to the costs, as shown in Table 9, would place the Massachusetts investigation level, with negative net PIP savings, to the right of both the A and B optimal levels. In general, this would imply that Massachusetts carriers were investigating more claims than the B optimal level. As we will see next, the judicious use of the suspicion score could have resulted in fewer IMEs by limiting investigations to only claims with moderate scores.[21]

8.3. Net savings by suspicion level
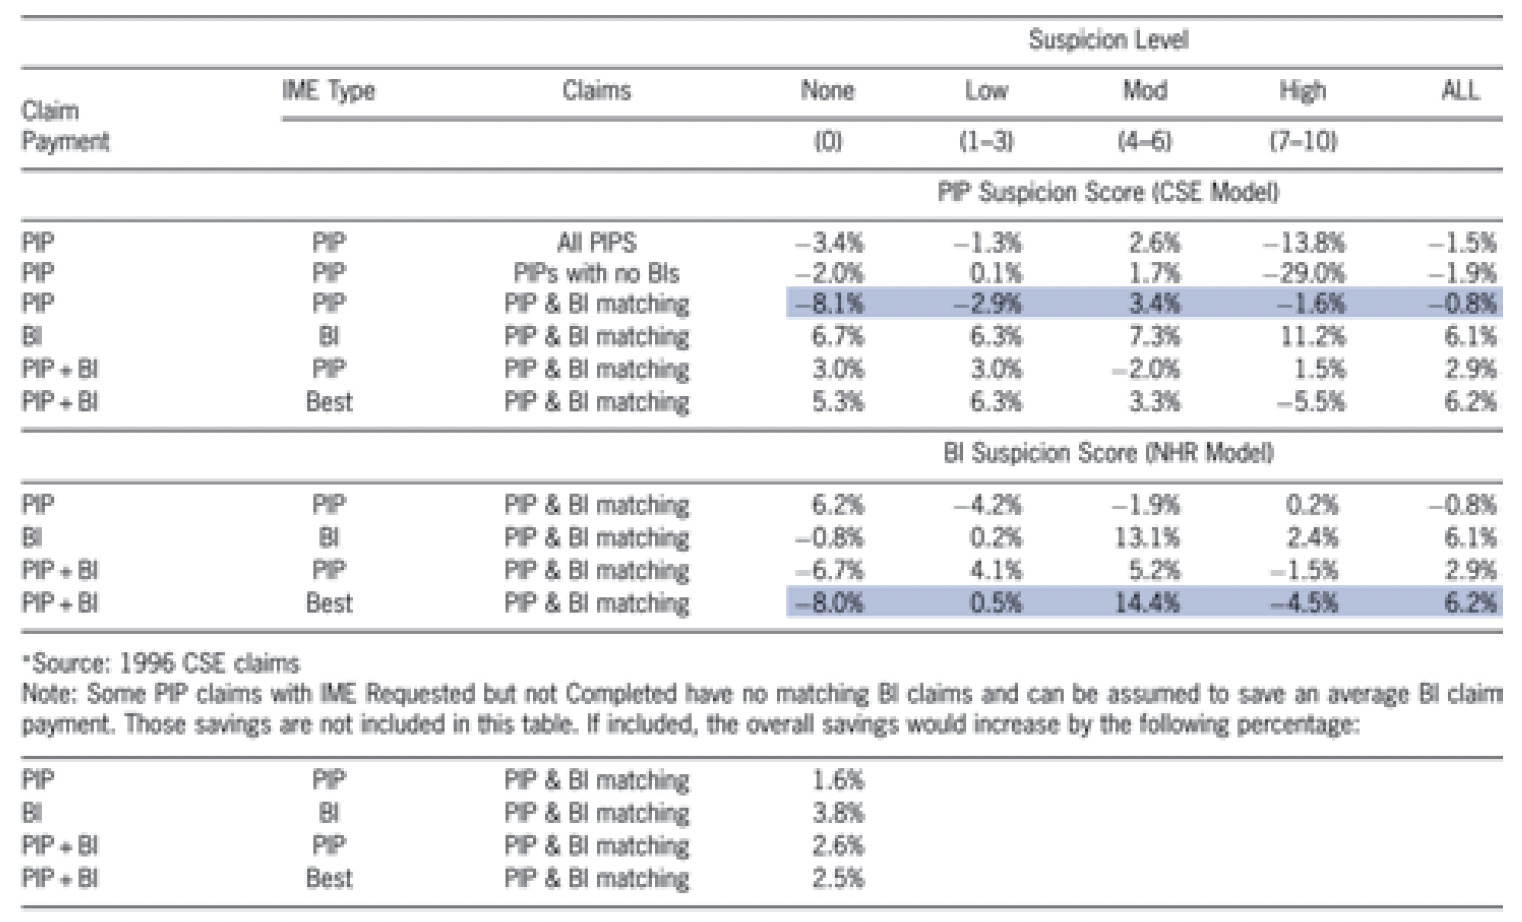
The CSE PIP adjusters collected data that was used to calculate and return a suspicion score on a 10-point scale. The suspicion score was based on a linear regression analysis (Weisberg and Derrig 1998). The net savings effects of the IMEs are analyzed separately by the level of suspicion in Table 10. A positive net saving on PIP occurred only for claims with a moderate level of suspicion (4–6). The results of the PIP IMEs are shown in the top line of Table 10. These results, based on the all PIP claims with IMEs, indicate a modest 2.6% net savings for moderately suspicious claims, and a net negative for other categories.

A subset of the PIP claims was found to result in BI claims. When attention is restricted to these BI-bound PIP claims, we obtain the results in line 3 (highlighted). For moderately suspicious claims, the estimated savings remains relatively unchanged at 3.4%. The other categories appear to change, but it should be noted that the numbers of claims with zero suspicion or high suspicion are fairly small in the BI sample. So, these changes might in part be attributable to random variation.
The bottom part of the table is similar, except that the suspicion breakdown is based on a different measure of suspicion. Since there was no suspicion score model for BI claims within the CSE, an alternative external scoring model developed by National Healthcare Resources, Inc., (NHR) is used.[22] This NHR model was used to obtain a suspicion score for the BI claims, based on the data extracted by coders from the BI claim files.
The critical line is the last in Table 10, which is highlighted. This line presents results for the best outcome (PIP or BI) for the matched sample. In effect, this analysis attempts to estimate the overall impact of IMEs, taking into account both the PIP payment and BI settlement. For moderately suspicious claims, there is a 14.4% net savings, which accounts for most of the total savings. For claims with slight suspicion, IMEs represent effectively a break-even proposition, and for the very low or very high suspicion a negative impact. It might appear counterintuitive that IMEs do not have a positive value for claims with high suspicion. Our explanation is that such claims are not very amenable to reduction through negotiation based on IME results. IMEs are used primarily to constrain the total amount of medical treatment, not to question the validity of the injury itself or the circumstances of the accident. To deal with “hard fraud” requires the techniques of special investigation (e.g., examination under oath (EUO), accident reconstruction, surveillance).
8.4. Comparison across samples
Table 9 showed an overall 8.7% net savings for the 1996 CSE claims, taking into account both BI and PIP payments and IMEs. This outcome is higher than the 5.7% for all claims (DCD) in 1996, which is in turn higher than the 3.8% registered in 1993. We now turn to the factors that produce the IME savings.
In general, there are two factors that determine the savings:
-
Percent of claims on which an IME was requested
-
Percent of completed IMEs with a positive outcome
Table 11 displays these percentages for each of the three cohorts reported in Table 9. Comparing first the 1993 sample versus the 1996 DCD, we find the total number of IME requests has remained essentially constant. However, the apparent effectiveness of the IMEs performed has increased dramatically. While this may be an artifact of the different coding patterns in the two samples, it could reflect increased sophistication on the part of adjusters regarding the selection and/or utilization of the performed IMEs.
The results for the 1996 CSE claims pinpoint where additional savings above the DCD estimates were being derived. During the CSE, IMEs were requested on a much higher percentage of those PIP claims destined to result in BI claims. For example, 40% of the DCD BI claims had either a PIP or BI IME requested, compared with 57% of the CSE sample. Since this increase occurred regardless of experimental or control status, the feedback of suspicion scores to the experimental group cannot explain this increase. Rather, we suspect that a “Hawthorne effect” may have resulted from the awareness by adjusters that a study was happening.[23]
Interestingly, the increased IMEs did not result in a diminution of IME effectiveness. The IMEs still produced positive outcomes at effectively the same rate, or perhaps somewhat higher. So the adjusters may have been quite discriminating in their selection of claims. In any event, it is encouraging that the CSE intervention may have in some manner generated an improvement in performance.
Table 11 also shows an IME requested (audit) ratio for strains and sprains of 32%, more than twice the 14% ratio for the remaining injuries. This large difference is indicative of a general strategy of auditing riskier (for fraud and buildup) classes of claims more often than less risky claims (Dionne, Giuliano, and Picard 2009). The similarity of positive outcome percentages for the two classes (59%, 55%) indicates that this differential auditing strategy is playing a role in deterring fraudulent and build-up claims as well as detecting them (Tennyson and Salsas-Forn 2002, 304–306).
A comparison with the national data on IME use in auto injury coverages is instructive. The IRC (2004b, pp. 93–98) study of 2002 claims countrywide shows that IMEs are used on about 40 percent of the less than 20 percent of PIP claims with an appearance of fraud or build-up or about 10 percent overall. By way of contrast, the Massachusetts claims in the IRC sample had about 50 percent more PIP claims (29%) with the appearance of fraud or buildup than the overall sample, suggesting an IME rate between 15 and 20 percent overall (IRC 2004b). The CSE analysis of Massachusetts PIP claims in Table 11 indicates a somewhat higher 1996 IME rate of 26 percent. For BI claims, the countrywide rate of IME use is less than 10 percent overall (IRC, 2003), consistent with the approximate 4 to 8 percent use of BI IMEs in Table 11 (compare upper table rows 2 and 3). As noted previously, the IMEs on PIP claims in Massachusetts produce a positive outcome (favorable to the insurer) slightly less than 60 percent of the time. Countrywide, over 80 percent of PIP claims are mitigated by the use of an IME, 90 percent on claims with the appearance of fraud or buildup. These comparative data reinforce the observation that Massachusetts insurers may be noncooperative IMEs at a rate in excess of the desired near-optimal level, perhaps because of the higher or broader levels of suspicious auto injury claims, and that a more judicious choice of claims, based upon suspicion scoring methods, would produce more cost-efficient results.
9. Conclusion
The optimal level of claim investigation depends on how many insurers are in the market and what the subrogation rules are for loss adjustment expenses. Viewing claim investigation strategy in a game theoretic framework demonstrates the incentives and disincentives that currently exist to investigate automobile insurance claims for excessive claim behavior. A framework for establishing Nash equilibria was developed for the monopoly and two-insurer cases. When insurers can choose two levels of investigation or none at all, the equilibrium is established by the relationship of the savings to the cost of investigation. Circumstances are identified for the case where Nash equilibrium may be inefficient. In no-fault systems, when subrogation of PIP claims exists, subrogation of allocated expense provides an incentive for investigation, but a percentage reimbursement for unallocated expense provides a disincentive.
Empirical results from Massachusetts personal auto injury claims were examined. Analyses of three data sets show that carriers are generating substantial net savings from IME investigations, but those savings accrue mostly to the tort carrier, indicating the workings of a noncooperative game near equilibrium. A closer look at the suspicion levels of the Massachusetts claims shows that (1) insurers may have been conducting too many IMEs and (2) that a better selection (more toward the optimal equilibrium) could be obtained with the use of a suspicion scoring model.
Based on this analysis, additional cooperative behavior should be encouraged in order to more effectively reduce excessive medical treatment and overall insurance costs. Subrogation rules should cover allocated loss adjustment expenses. If unallocated loss adjustment expenses are also subject to subrogation, these payments should be a set amount for each claim, and not a function of claim size, as claim size adjustment provides a disincentive to spend time and money to reduce fraudulent claim costs. Other methods to encourage insurers to engage in strategically optimal approaches to investigating claims should be developed that consider the long-term, industry-wide impact of reducing fraud.
Finally, the empirical data used above in the study of Massachusetts claims was examined as presented without optimizing beyond what individual companies procedures produced for claim investigation at that time. It is clear from Table 10 results that suspicion scores can be used to select better candidates for investigation with higher net savings and the application of so-called predictive models can increase efficiency through better claim selection methods (Derrig and Francis 2008). Many such procedures have been covered in the annual CAS Ratemaking Seminars and in the published literature, for example, Dionne, Guilliani, and Picard (2009) and Artís, Ayuso, and Guillén (2002).
Miller characterizes a Nash Equilibrium as “a no regrets outcome in which all the players are satisfied with their strategy given what every other player has done.”
PIP coverage in no-fault states includes compensation for wage loss and other benefits.
See Loughran 2005 for an extensive analysis of auto BI liability general damage settlements.
The Insurance Research Council provides countrywide claims handling outcome data for these three techniques for a sample of 2002 bodily injury claims (IRC 2003, pp. 92–104).
The Insurance Research Council provides an analysis of their 2002 claim sample for four no-fault states: Colorado (now a full tort state), Florida, New York, and Michigan (IRC 2004a).
Insurers generally pay, for example, a fixed amount for an IME. If the claimant does not appear for the examination, the fee is reduced, but the insurer would not know, when requesting the IME, if the claimant will appear for it or not. SIU investigations cost more than IMEs and Medical audits cost less. The use of multiple techniques is relatively small. Thus, the assumption is made that the expected cost of an investigation is the same for each claim, and the function is linear.
Dionne, Guiliano, and Picard (2009) derive varying optimal levels of investigation depending on a (fraud) risk class partition of the set of claims.
Medical payments excess of PIP in a no-fault state, for example.
This insurer might prefer to investigate the claims it knows it has the liability insurance coverage on up to the aggregate level, and only investigate the remaining claims on which there is either no liability coverage or coverage provided by the other insurer, if it could identify those claims. However, there are several problems with this strategy. First, an insurer may not know if another company will be liable for a claim or not early enough in the claim process to make this distinction. Second, adopting a claim process that requires claims adjusters to have different strategies for investigation can complicate the process and increase overall costs. Based on discussions with claims personnel, such differential strategies are not common.
Table 7 shows that 35 of the 51 jurisdictions allow subrogation of PIP and/or MedPay to the liability carrier.
In cases where the liability insurer negotiates an overall fair settlement independent of the PIP claim investigation result, and pays that settlement less the PIP payment to the claimant, there would be no effect from PIP levels of investigation on the liability insurer. Generally, however, a favorable PIP investigation may curtail treatment, limit both PIP and overall economic damages and, thus, lower the (total) liability settlement. The latter is the situation we assume.
Recent changes in annual statement reporting have two new categories: Defense and Cost Containment Expenses (DCCE), which parallels the allocated expense category, and Other Adjusting Expense (OAE) that parallels the unallocated expense category. Our paper continues to use the prior terminology of allocated and unallocated expense for expenses assignable to particular claims and those expenses that are not, respectively.
In Massachusetts with only 18 active personal auto insurers, approximately 80 percent of liability claims have different PIP and liability insurers.
The liability insurer may not be able to reduce the claimed medical expenses but the negotiated award may be lower if the additional treatment is known or suspected of being unnecessary (Derrig and Weisberg 2004).
IRC 2004a provides contrasting medical expense and total claim cost in four no-fault states, one of which (Colorado) has subsequently changed to a system of tort liability only.
Additionally, a failing insurer will attempt to minimize the subrogation payments to other insurers giving yet another sign of financial weakness.
Separate insurance fraud bureaus in the United States are, however, chiefly concerned with reducing criminal fraud with the savings accruing to the policyholders of all insurers just as the costs are shared among all policyholders.
There is also a verbal threshold (Mass C351 s6D) listing particular injuries that can be compensated by general damages but those injuries generally incur medical expenses in excess of $2,000, as well. Those compensatory injuries are (1) cause of death, (2) consists in whole or in part of loss of a body member, (3) consists in whole or in part of permanent and serious disfigurement, (4) result of loss of sight or hearing and (5) consists of a fracture.
A random sample of all reported claims.
The Claim Screen Experiment (CSE) tracked about 3,000 PIP claims arising at four large carriers during May–September, 1996. Each carrier tracked the arrival of a preset collection of “red flags” which in turn generated a running suspicion score for the adjusters and their supervisors. Outcomes were recorded for all PIP claims and for any associated BI tort liability claim.
This, of course, is easier said from hindsight than done in real time. The complication in making the decision to investigate is the tension between the timing of the arrival of the red flags that determine the risk class and the ongoing treatment.
This scoring product was originally developed by Correlation Research, Inc., while it was owned by National Healthcare Resources, Inc. (NHR). NHR subsequently became part of Concentra, Inc.
“Paying attention to people, which occurs in placing them in an experiment, changes their behavior. This rather unpredictable change is called the Hawthorne effect.” (Kruskal, W. H. and J. M. Tanur,, International Encyclopedia of Statistics, Free Press, New York, vol. 4, p. 210, 1978).