


1. Introduction
Workers compensation is a very long-tailed line of insurance, since policies written today may generate payouts for many decades. Thus, the degree of uncertainty surrounding the ultimate loss is significant. The most important input to rational decisions in ratemaking and reserving is historical data, from which the process that generates future losses may be discerned. Unfortunately, loss triangles that extend beyond the cessation of payments in the first accident year (which may occur after 60 development years or more) are hard to come by, which explains the dearth of public knowledge about the trajectory of incremental payments for very mature claims.
This paper attempts to improve the state of information on the payment patterns of workers compensation triangles by analyzing a set of two triangles, the development years of which extend into a maturity range where these triangles start exhibiting incremental payments at zero amounts. The first triangle concerns indemnity benefits and has been made available by SCF (State Compensation Fund) Arizona. The second triangle comprises the medical component of permanent disability (PD) claims and has been provided by SAIF (State Accident Insurance Fund) Oregon.
The SAIF triangle has previously been studied by Sherman and Diss (2006). These authors pose the hypothesis of a bulge in incremental payments at high maturities, as may be caused by “added costs of caring for the elderly.” The analysis presented here does not support this hypothesis.
The following section outlines important properties of the Bayesian loss development model that has been devised for the analysis; a generalized version of this model has been made available in the R software package lossDev. Then, in a subsequent section, the model is applied to the SCF Arizona indemnity triangle (Section 3.1) and the SAIF Oregon triangle (Section 3.2). These two empirical applications of the model offer important insights into the development patterns of indemnity and medical claims payments at high maturities. Section 4 concludes.
2. The model
The statistical model of loss development employed in the analysis is Bayesian and is estimated using MCMC (Markov chain Monte Carlo simulation). The model treats incremental payments as a three-dimensional time series problem, similar to the approach taken by Barnett and Zehnwirth (2000) and Zehnwirth (1994). Specifically, the incremental payments are driven by three time processes, which manifest themselves in exposure growth, development, and the calendar year effect; these processes are illustrated in Figure 1.
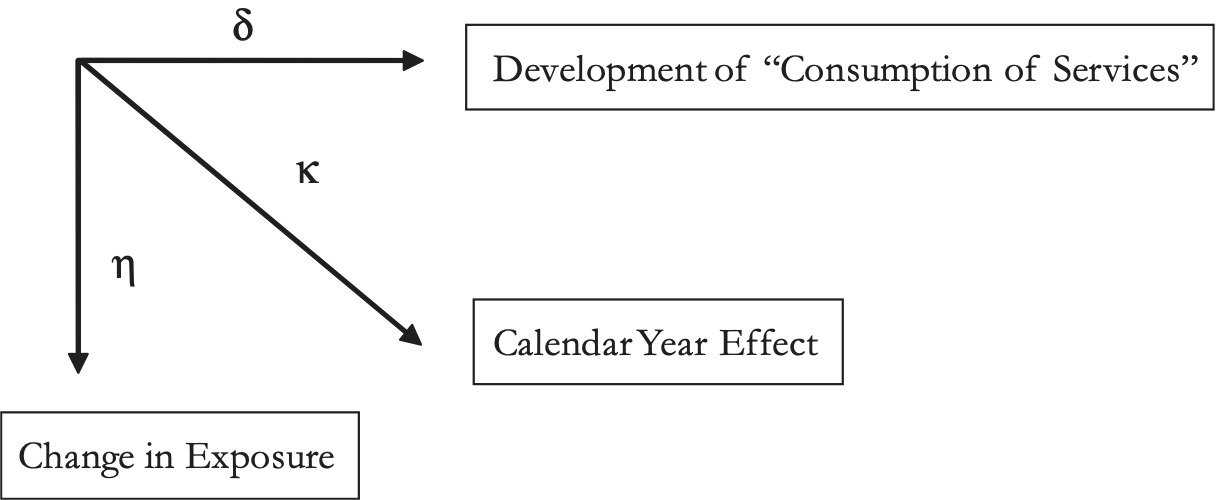
In the model, the growth rate that represents the calendar year effect is denoted κ. The rate of exposure growth, η, is net of the calendar year effect. The growth rate δ is the rate of decay in incremental payments, adjusted for the calendar year effect. Incremental payments that have been adjusted for the calendar year effect (and, hence, have been adjusted for inflation) represent consumption of units of (for instance, medical) services. A decline in consumption at the level of the aggregate loss triangle may be due to claimants exiting or remaining claimants decreasing their consumption.
What follows is a description of the main components of the model. After describing the likelihood, there follows a discussion of the modeling of the calendar year effect and of exposure growth. Further, there are details on how to model a structural break in consumption and how to employ Reversible Jump MCMC for estimating the trajectory of the consumption path without and with a structural break. The section concludes with a presentation of the estimation of the probability of payment. Note that both triangles studied here consist of accident year data.
2.1. The Student’s t likelihood
The loss development model fits to logarithmic incremental payments; non-positive incremental payments are treated as missing values. The model uses a Student’s t likelihood to accommodate heavy tails; this t distribution is implemented as a scale mixture of normal distributions (Gelman et al. 2004, 446); further, the degrees of freedom of this t distribution are determined within the model, but are restricted to values greater than 2 to ensure the existence of a finite variance. Finally, this t distribution accommodates heteroskedasticity by allowing the scale parameter to vary with development time; this time variation is estimated using a second-order random walk smoother (Congdon 2005, 141).
The Student’s t likelihood consists of
yi,j∼N(μi,j,ωi,j⋅τj)
μi,j=i+j∑k=2κk+i∑k=1ηk+Sj
ωi,j∼Ga(v/2,v/2)
τj=1/σ2j
log(σ2j)∼N(2⋅log(σ2j−1)−log(σ2j−2),v),j≥3
v∼Ga(5,0.5)
σj∼U(0,10),j=1,2
v∼χ2(8)I(2,50)
where the indexes indicate the row (exposure year) and the column (development year) of the triangle, respectively, and the operator refers to the natural logarithm. Equation (1a) states that the log incremental payments are modeled as a scale mixture of normal distributions. The expected value of a given incremental payment as specified in Equation (1b), equals the calendar year effect-adjusted incremental payment of the corresponding column in the first row of the triangle plus the calendar year effects and the exposure growth that has accumulated since the first payment in the first accident year Note that since there is no exposure year 0 . Similarly, this is because the index of the calendar year effect refers to the number of the diagonal, and the first calendar year effect is the one for diagonal (relative to diagonal ). The precision (i.e., inverse of the variance) of the normal distribution is the product of a gamma-distributed random variable as defined in Equation (1c), and the inverse of the square of a scale parameter that varies by development year and is defined in Equation (1d). The logarithm of the square of this scale parameter follows a second-order random walk, starting in development year 3, as described in Equation (1e). The innovation variance of this random walk is modeled as an inverse gamma distribution with smoothing parameters 5 and 0.5; see Equation (1f). Equation (1g) presents the prior distributions of the scale parameters of the first two development years. Finally, Equation (1h) defines the prior for the degrees of freedom; following Meyer and Yu (2000), this prior is a χ2(8) distribution that is restricted to the interval (2,50).
The variable represents (in logarithmic terms) the consumption of (medical or indemnity) services in development year normalized to the level of exposure of the first accident year. The trajectory of consumption from the first to the final development year, is estimated using a linear spline, the number of knots of which are estimated using Reversible Jump MCMC, as is to be discussed in Sections 2.5 and 2.6. The (logarithmic) rate of decay is backed out of :
δj=Sj−Sj−1,j≥2
Clearly, because there is no development year 0, δ1 = 0. Solving Equation (1i) for and inserting it into Equation (1b) delivers
μi,j=S1+i+j∑k=2κk+i∑k=1ηk+j∑k=1δk
which states that the expected log incremental payment equals the first expected log payment (located in the first row and first column) (S1), plus the accumulated calendar year effects the cumulative exposure growth and the cumulative decay in consumption
The growth rates κ, η, and δ are transformed from the logarithmic scale to the raw scale (by means of exponentiation) for each individual draw of the MCMC updates. The charts in Section 3 of the decay rate, of the exposure growth rate, and of the calendar year effect all rest on growth rates that have been transformed in such a way.
2.2. The calendar year effect
The calendar year effect (κ) is modeled as a normal distribution around an expert prior (µκ), the standard deviation of which has a uniform prior:
κi+j∼N(μκ,i+j,τk),i+j≥3
τk=1/σ2k
σk∼U(0,10)
For indemnity triangles, an appropriate expert prior is the legally stipulated rate of escalation; for Arizona, this rate is zero. For medical triangles, a suitable expert prior is the (logarithmic) rate of inflation of the Medical Care component of the CPI (Consumer Price Index), M-CPI for short. It can be shown that any systematic difference between the logarithmic rate of M-CPI inflation and the (actual but unknown) logarithmic rate of inflation that applies to medical payments on workers compensation claims feeds into the rates of exposure growth and the rates of decay without affecting the estimated log incremental payments. This is because we can rewrite Equation (1b′) as
μi,j=S1+i+j∑k=2(κk−c)+i∑k=1(ηk+c)+j∑k=1(δk+c)
Let us assume that (in logarithmic terms) the M-CPI is systematically below the workers compensation price index by a constant this means that the posterior for the calendar year effect centers on a value that is systematically underestimated. In this case, the constant feeds into both the rate of decay and the rate of exposure growth thereby leaving the expected log incremental payments unaffected. This arithmetic relation among the three growth rates reduces the discussion about the adequacy of the M-CPI rate of inflation as an expert prior for the workers compensation medical rate of inflation to a matter of interpretation regarding the rate of decay and the rate of calendar year effectadjusted exposure growth
For the purpose of squaring the triangle and, if applicable, estimating future exposure years, it is necessary to simulate future calendar year effects. Such simulation necessitates an assumption about the future behavior of the expert prior around which the future calendar year effect is normally distributed with the posterior precision τκ. For the indemnity triangle, the expert prior of future calendar year effects is simply set to zero. For the medical triangle, the expert prior is the simulated logarithmic rate of M-CPI inflation. This rate of inflation is specified as an Ornstein-Uhlenbeck process, similar to long-term interest rates (see Vasicek 1977). The Ornstein-Uhlenbeck process models the logarithmic rate of inflation as a stochastic process with transitory random shocks, as opposed to the random walk, where all innovations are permanent. As a result, the simulation of future rates of inflation using the Ornstein-Uhlenbeck process implies a return of the inflation rate to its long-term mean.
In discrete time, the Ornstein-Uhlenbeck process can be calibrated by estimating the following first-order autoregressive model (see Dixit and Pindyck 1994):
μκ,i+1=N(a⋅μk,i+b,τε),0<a<1
where a, b, and the precision τε are the parameters to be estimated, and µκ,i are the observed (log) rates of M-CPI inflation. The rate of inflation µκ,i reverts to the mean b/(1 − a) at the rate −log(a). The innovation variance of the shocks reads (see Dixit and Pindyck 1994)
1τε⋅−2log(a)(1−a)2
The Ornstein-Uhlenbeck process was calibrated using the entire history of the M-CPI rate of inflation up to the year of the final observed diagonal of the SAIF triangle, thus comprising the years 1935 through 2005. The following prior distributions were employed, all of which are highly uninformed:
a∼Beta(1,1)
b∼N(0,10−6)
τε∼Ga(0.001,0.001)
After calibrating the Ornstein-Uhlenbeck process to historical data, it is a straightforward procedure to simulate future values for the rate of inflation, which deliver the expert priors for future calendar year effects of the SAIF medical triangle.
2.3. Exposure growth
The rate of exposure growth is modeled as a draw from a normal distribution that accommodates heteroskedasticity by allowing the logarithm of the squared scale parameter to vary with the exposure (e.g., accident) year, similar to the logarithm of the squared scale parameter of the Student’s t distribution. This time variation is estimated using a second-order random walk smoother. The need for a time-varying scale parameter arises from the comparatively high rates of change in volume in the early years of the SCF Arizona and SAIF Oregon triangles. The equations for the rate of exposure growth read
ηi∼N(μη,τη)
μη∼N(0,1)
τη,j=1/σ2η,j
log(σ2η,j)∼N(2⋅log(σ2η,j−1)−log(σ2η,j−2),vη),j≥4
vη∼Ga(5,0.5)
σn,j∼U(0,10),j=2,3.
Equation (3a) defines the normal distribution, the expected value of which has a highly uninformed prior. The equations for the scale parameter (Equations 3c-f) are equivalent to those contributing to the Student’s t likelihood (Equations 1d-g).
2.4. Structural break
There are two versions of the model, “standard” and “break.” The standard version assumes that the consumption path of services (i.e., the trajectory of exposure-adjusted and calendar year effect-adjusted log incremental payments) is invariant to exposure time (e.g., the accident year), thus resulting in a trajectory S1, S2 . . . SK that applies uniformly to the entire triangle. The break version of the model allows for a (single) structural break in this consumption path, thus differentiating between a pre-structural break trajectory R1,1, R1,2 . . . R1,K and a post-structural break trajectory R2,1, R2,2 . . . R2,L, where L K is the final exposure year of the interval in which the structural break is allowed to occur. Both trajectories are estimated as linear splines using Reversible Jump MCMC, as discussed in Section 2.5.
The model estimates the probability distribution of the change point in the consumption path within a provided interval of exposure years. Such an interval may be set at one year or may comprise multiple years. Within this interval, the consumption paths of the exposure years are mixtures of the pre-break path and the post-break path, except in the extreme case that the model assigns all probability mass to a single year, in which case each year belongs strictly to the pre-break regime or the post-break regime. The change point (C) has a scaled, shifted, and truncated beta prior:
˜C∼Beta(2,2)
C= floor (˜C⋅((L+1)−M))+M,
where M (M ≤ L) is the first year in the interval of exposure years during which the structural break is allowed to occur, L is the last year, and C represents the first year in the new regime; the operator floor(⋅) rounds down to the nearest integer. The density of the beta distribution (Equation 4a) is hump-shaped, thus allocating more probability mass to the center of the interval than to the edges. If the break interval comprises two exposure years, the prior accords each year the same probability of hosting the change point.
In the break version of the model, the consumption path is no longer uniform across the cells of the triangle. Thus, Equation (1b) has to be replaced by
μi,j=i+j∑k=2κk+i∑k=1ηk+Vi,j
Vi,j=R1,j⋅I(C>i)+R2,j⋅I(C≤i),
where I(⋅) is an indicator function that is equal to unity if the statement in the parenthetical is true, and zero otherwise.
2.5. Consumption path
The consumption path is modeled as a linear spline. A linear spline is a piece-wise linear trajectory that changes slopes in locations known as knots. Gimenez et al. (2008) discuss the implementation of a linear spline using MCMC; this spline has a fixed number of knots, but the locations of these knots are endogenous. Because the location of a knot has a posterior distribution instead of just a point mass in a single location, the posterior of a linear spline is not necessarily piece-wise linear but may display a fair degree of smoothness, depending on the number of knots and the posterior uncertainty about their locations. In what follows, a linear spline is implemented where both the number of knots and the locations of these knots are endogenous. The variation in the number of knots implies variation in the dimension of the parameters that need updating. RJMCMC (Reversible Jump MCMC) is an MCMC sampling technique that accommodates such variation in dimension. The implementation of RJMCMC discussed below draws on Lunn, Best, and Whittaker (2008).
2.5.1. Consumption path without structural break
In the version of the model that does not allow for a structural break, the linear spline specification of the consumption path reads
Sj=β0+ξ∑g=1βg⋅(j−θg)⋅I(j−θg>0)
βg∼N(0,0.0001),g=0…ξ
ϑ1=1
ϑg−1(b−1)∼Beta(1,2),g=2…ξ
θ1..ξ=Sort(ϑ1..5)
ξ∼Cat(p1…pλ),pi=1/λ,i=1…λ
Equation (5a) describes the linear spline, which consists of an intercept and a series of parameters that indicate the slope of the linear trajectory; the summation index represents the number of knots. In the first development year, the level of consumption equals the intercept For (assuming otherwise the following equation is unrestricted), The first change in slope (assuming ) occurs at knot location to the right of which (and up to a possible right-neighboring knot) consumption equals To the right of (and up to assuming ), consumption equals and so on. Equation (5e) sorts the locations of the knots (from smallest to largest development year), thereby allowing for easier interpretation of Equation (5a); the parameter indicates the location of a knot before sorting. The prior distributions for the parameters are displayed in Equation (5b).
Equation (5c) sets the location of the first knot to development year 1. Equation (5d) defines the prior distribution for the locations of all other knots as a beta distribution with proper support; the support is defined such that these knots are located in development years between and exclusive of the first development year and the second to last development year that exhibits a positive incremental payment. Equation (5f) affords equal probability to each number of knots (ξ) in the set of integers greater than or equal to unity but less than or equal to λ, where K is the number of columns of the triangle (as mentioned).
2.5.2. Reversible jump Markov chain Monte Carlo implementation
Figure 2 displays the stochastic dependence graph for the parameters updated by means of the RJMCMC algorithm. Solid lines indicate stochastic dependence, whereas dashed lines indicate deterministic dependence. The set {UL} corresponds to the set of indices that pertains to the upper left (UL) portion of the triangle (exclusive of missing or non-positive values, since these values have no bearing on the likelihood). Parameters outside the oval, some of which are shown in Figure 2 to build intuition, are updated (in turn) via more traditional methods, such as slice sampling or Gibbs sampling. The performed RJMCMC update is conditional on the current values of the parameters outside the oval. The nodes with broken outlines need not be included in the RJMCMC update step, since their dimensions are constant; yet, including these nodes greatly aids convergence due to their high correlation with

The RJMCMC update process is largely based on Lunn, Best, and Whittaker (2008) and can be organized into four steps: (1) propose a move type, (2) propose a new knot vector, (3) accept or reject the proposed move, and (4) update the remaining parameters inside the oval of Figure 2 via Gibbs sampling. Details of these four steps are presented below.
2.5.2.1. Proposing a move type
At random, a new move type is proposed. Possible moves include birth, death, shuffle, and no change. A birth is the addition of a random number of knots while leaving all current knots in place; a death is the removal of a random number of knots; a shuffle leaves the number of knots unchanged but rearranges a random number of knots; and no change leaves the current number of knots and their positions unchanged.
The type of the proposed move must respect the lower and upper bounds on the number of knots. For instance, if the current number of knots is unity (the lower bound), no death is allowed to occur; similarly, if the current number of knots is equal to λ (the upper bound), no birth is allowed to occur. In order to incorporate these constraints, the probability of proposing a given move type is made a function of these bounds and the current number of knots.
If the proposed move is of type no change, and are set to and and the process proceeds immediately to step 4. (The superscript (t) refers to the iteration number of the Markov chain.) Otherwise, the number of knots to alter equals unity plus an integer proposed from a Poisson distribution that is truncated so as to respect the mentioned bounds on the number of knots.
2.5.2.2. Proposing a new knot parameter vector
Let the number of knots to alter be denoted If the proposed move is of type birth, then (the proposed value) is set to Then, for each of the new knots that are to be generated, a new knot is proposed at random from either a uniform distribution or a beta distribution centered on a knot randomly selected from after scaling. If the proposed move is of type death, then is set to and randomly selected knots are eliminated, in turn, from If the proposed move is of type shuffle, then is set to and randomly selected knots are eliminated from Then, using the surviving knots as a basis, a birth of knots is performed.
2.5.2.3. Accepting or rejecting the proposed move
In what follows, the acceptance probability ρ = min(ρ′,1) of the newly proposed number of knots (ξ′) and knot vector (θ′) is calculated. As in Lunn, Best, and Whittaker (2008), the acceptance probability is calculated solely based on ξ and θ. This is accomplished by integrating out β, κ, µη, and η. Thus, we can write:
ρ′=p(y∣ω(t),τ(t),μ(t)k,τ(t)k,τ(t)η,θ′,ξ′)×p(ξ′)×p(θ′∣ξ′)p(y∣ω(t),τ(t),μ(t)k,τ(t)k,τ(t)η,θ(t),ξ(t))×p(ξ(t))×p(θ(t)∣ξ(t))×Prop({θ′,ξ′}→{θ(t),ξ(t)})Prop({θ(t),ξ(t)}→{θ′,ξ′})
where is the probability of proposing given the current state and is the probability of proposing the reverse move. Then, with probability is set to otherwise, is set to
2.5.2.4. Updating the remaining parameters
Let All elements of the vector have a (conditional) normal prior. Furthermore, where is a linear combination of the elements of As a result, the (conditional) posterior of is multivariate normal, which makes the Gibbs sampler available. The algorithm for sampling from rests on a section of JAGS source code that has been modified to accommodate the variability in the dimension of The value is drawn directly from the (conditional) posterior of
2.6. Consumption path with structural break
The break version of the model allows for a structural break in the consumption path across exposure years. A structural break implies different trajectories of log incremental payments (adjusted for exposure growth and calendar year effects) before and after the interval of exposure years in which the structural break is allowed to occur; as discussed, the consumption paths that apply to the individual exposure years within the interval are mixtures of the two the trajectories. Whereas in the standard model this trajectory is denoted in the break model, the pre-break trajectory reads and the post-break trajectory reads In accordance to the standard model, the consumption paths are modeled as linear splines:
Ri,j=βi,0+ξ∑g=1βi,s⋅(j−θi,8)⋅I(j−θi,s>0),i=1,2
βi,g∼N(0,0.0001),g=0…ξi,i=1,2
ϑi,1=1,i=1,2
ϑi,s−1(bi−1)∼Beta(γi,1,γi,2),g=2…ξi,i=1,2)
ϑi,1…ξi=Sort(θi,1…ξi),i=1,2
ξi∼Cat(p1…pλi),pj=1/λi,j=1…λi,i=1,2.(5 m)
All applicable interpretations of variables and parameters are carried forward from Section 2.5.1. Equation (5k) states that the priors for and are beta distributions with proper support. The support is defined in such a way that are all greater than unity but less than the second to last development year that exhibits a positive incremental payment, and are all greater than unity but less than where is the number of columns of the triangle (as mentioned) and is the first year in the interval of exposure years during which the structural break is allowed to occur (as discussed). The parameters for the beta distributions are defined as and Equation (5m) affords equal probability to each number of knots in the set of integers greater than or equal to unity but less than or equal to where floor and
2.6.1. Reversible jump Markov chain Monte Carlo implementation
Figure 3 displays the stochastic dependence graph for the parameters updated by means of the RJMCMC algorithm. The meaning of solid and dashed lines is consistent with Figure 2, as is the meaning of the oval and nodes with broken outlines.
.png)
The RJMCMC update step for the break case is again largely based on Lunn, Best, and Whittaker (2008) and merely an extension of the algorithm discussed in the context of the standard model. The proposal is made using the algorithm discussed in Sections 2.5.2.1 and 2.5.2.2, while keeping the current values and fixed. The acceptance probability for is calculated as where
\begin{array}{l} &\quad p\left(y \mid \omega^{(i)}, \tau^{(t)}, \mu_{k}^{(t)}, \tau_{k}^{(t)}, \tau_{n}^{(t)}, \theta_{1}^{\prime}, \xi_{1}^{\prime}, \theta_{2}^{(i)}, \xi_{2}^{(t)}\right) \\ p_{1}^{\prime}&=\frac{\times p\left(\xi_{1}^{\prime}\right) \times p\left(\theta_{1}^{\prime} \mid \xi_{1}^{\prime}\right)}{p\left(y \mid \omega^{(t)}, \mathbf{\tau}^{(t)}, \mu_{\mathrm{k}}^{(t)}, \mathbf{\tau}_{k}^{(t)}, \mathbf{\tau}_{n}^{(t)}, \theta_{1}^{\prime}, \xi_{1}^{\prime}, \theta_{2}^{(t)}, \xi_{2}^{(t)}\right)} \\ &\quad \times p\left(\xi_{1}^{(t)}\right) \times p\left(\theta_{1}^{(t)} \mid \xi_{1}^{(t)}\right) \\ &\quad \times \frac{\operatorname{Prop}\left(\left\{\theta_{1}^{\prime}, \xi_{1}^{\prime}\right\} \rightarrow\left\{\theta_{1}^{(t)}, \xi_{1}^{(t)}\right\}\right)}{\operatorname{Prop}\left(\left\{\theta_{1}^{(t)}, \xi_{1}^{(t)}\right\} \rightarrow\left\{\theta_{1}^{\prime}, \xi_{1}^{\prime}\right\}\right)} \\ \end{array} \tag{5.n}
The proposal is also made using the algorithm outlined in Sections 2.5.2.1 and 2.5.2.2, but keeping the updated values and fixed. The acceptance probability for is calculated as where
\begin{array}{l} &\quad p\left(y \mid \omega^{(t)}, \tau^{(t)}, \mu_{\mathrm{k}}^{(t)}, \tau_{k}^{(t)}, \tau_{n}^{(t)}, \theta_{1}^{(t+1)}, \xi_{1}^{(t+1)}, \theta_{2}^{\prime}, \xi_{2}^{\prime}\right) \\ p_{2}^{\prime}&=\frac{\times p\left(\xi_{2}^{\prime}\right) \times p\left(\theta_{2}^{\prime} \mid \xi_{2}^{\prime}\right)}{p\left(y \mid \omega^{(t)}, \tau^{(t)}, \mu_{\mathrm{k}}^{(t)}, \tau_{k}^{(t)}, \mathbf{\tau}_{\eta}^{(t)}, \mathbf{\theta}_{1}^{(t+1)}, \mathbf{\xi}_{1}^{(t+1)}, \mathbf{\theta}_{2}^{(t)}, \mathbf{\xi}_{2}^{(t)}\right)} \\ &\quad \times p\left(\xi_{2}^{(t)}\right) \times p\left(\theta_{2}^{(t)} \mid \xi_{2}^{(t)}\right) \\ &\quad \times \frac{\operatorname{Prop}\left(\left\{\theta_{2}^{\prime}, \xi_{2}^{\prime}\right\} \rightarrow\left\{\theta_{2}^{(t)}, \xi_{2}^{(t)}\right\}\right)}{\operatorname{Prop}\left(\left\{\theta_{2}^{(t)}, \xi_{2}^{(t)}\right\} \rightarrow\left\{\theta_{2}^{\prime}, \xi_{2}^{\prime}\right\}\right)} \\ \end{array} \tag{5.o}
The (conditional) posterior for the remaining parameters is again multivariate normal. Hence, as in Section 2.5.2.4, the value is drawn directly from the conditional posterior of
2.7. Probability of payment
The discussed model of loss development fits to logarithmic incremental payments. Because the logarithm of zero or less is undefined, incremental payments at amounts of zero or at negative amounts are treated as missing values. Generally, the estimated rate of decay responds to declines in incremental payments as development time progresses; yet, the rate of decay is insensitive to declines to zero because amounts of zero register as missing values on the logarithmic scale. As a result, without accounting for this decline in the probability of payment, the model overestimates the ultimate loss. The solution to this problem is to estimate a trajectory of the probability of payment alongside the model and, draw by draw, multiply the estimated incremental payment by the outcome of a Bernoulli process that models the probability that the payment occurs.
The probability of payment is a function of the number of open claims, which is itself a function of development time and exposure. Because the level of exposure cannot necessarily be assumed as time-invariant, possibly due to a positive trend rate of growth in business volume, the probability of payment may vary along the accident year time axis. At the same time, because all observations of payments at zero amounts that are available for estimating the trajectory of the probability of payment are from high maturities, the estimated trajectory may be appropriate only for the early accident years. For more recent accident years, this trajectory may have to be adjusted, using data that is external to the loss triangle, such as mortality tables or legislative information.
In a given triangle, observations of payments at zero amounts may be sparse, if not nonexistent. Further, although the proportion of payments at zero amounts by column may increase as development time progresses, the total number of observations by column invariably converges to unity before the triangle runs out of reported development years. For this reason, when estimating the Bernoulli process, the prior of the parameter of this Bernoulli distribution, which varies by development year, is determined using a parametric specification. The chosen functional form is a Gompertz curve, which affords the trajectory of the Bernoulli parameter a fair amount of flexibility. The Gompertz curve is restricted to values between zero and unity, thereby leaving two parameters to estimate.
The Bernoulli approach to modeling the probability of payment reads
u_{i, j} \sim \operatorname{Bern}\left(p_{j}\right) \tag{6.a}
p_{j}=1-\exp \left(-\varphi_{1} \cdot \exp \left(-\varphi_{2} \cdot j\right)\right) \tag{6.b}
\log \left(\varphi_{1}\right) \sim N\left(\log \left(\mu_{\varphi_{1}}\right)-\frac{1}{2 \cdot \tau_{\varphi_{1}}}, \tau_{\varphi_{1}}\right) \tag{6.c}
\log \left(\varphi_{2}\right) \sim N\left(\log \left(\mu_{\varphi_{, 2}}\right)-\frac{1}{2 \cdot \tau_{\varphi_{2}}}, \tau_{\varphi_{2}}\right) \tag{6.d}
\tau_{\varphi_{i}} \sim \operatorname{Ga}(10,0.1), i=1,2 \tag{6.e}
The expected values of the prior distributions of the Gompertz parameters in Equations are chosen based on data exploration prior to estimating the model but, at the same time, impose little restriction on the functional form due to the selected gamma priors. For the SAIF Oregon triangle, these expected values read for the SCF Arizona triangle, it is
3. Empirical evidence
What follows is an application of the outlined loss development model to the SCF Arizona indemnity triangle and the SAIF Oregon PD medical triangle. The model was estimated in R 2.7.1, using JAGS 1.0.3. The estimation made use of three Markov chains with a burn-in of 2,000,000 iterations and a sample of 2,000,000 iterations, thinned by 5, thus resulting in a sample size of 1,200,000. Each Markov chain was assigned to one processor (on a multi-processor computer) to speed up computation. The estimation results of the SCF indemnity triangle and SAIF medical triangle are presented in Section 3.1 and Section 3.2, respectively.
3.1. Empirical evidence for the SCF Arizona indemnity triangle
The SCF Arizona indemnity triangle consists of accident year data and comprises 66 years of development; the accident years range from 1938 through 2003. The original triangle extends back to accident year 1930, but is only sparsely populated in accident years 1930–1937; hence, these early accident years are excluded from the analysis. The first fully populated diagonal of the SCF triangle falls into calendar year 1988. See Appendix A for a schematic exposition of this triangle.
There were no significant legislative reforms in workers compensation in Arizona during the period 1988 through 2003 (which is the time window covered by fully populated diagonals) that would have given rise to a structural break in the consumption path of indemnity benefits. Hence, no change point specification was included in the model. The results for the SCF Arizona indemnity triangle are summarized in Figures 4 through 16.
_and_estimated_(lines)_logarithmic_incremental_payments.png)
Figure 4 presents (in logarithmic terms) the incremental payments, as observed (indicated by circles) and predicted (indicated by lines; each line represents one accident year). In this chart, predicted values are reported only for positive log incremental payments, as indicated by breaks in the lines. Note that no single accident year covers more than 23 development years; most accident years comprise no more than 16 development years; hence, the displayed trajectories of incremental payments each apply only to a limited bracket of (contiguous) development years. Observed and incremental payments line up well, which is in part due to the triangle being one of indemnity payments (as opposed to medical payments); the magnitude of indemnity payments is legally stipulated and highly predictable.
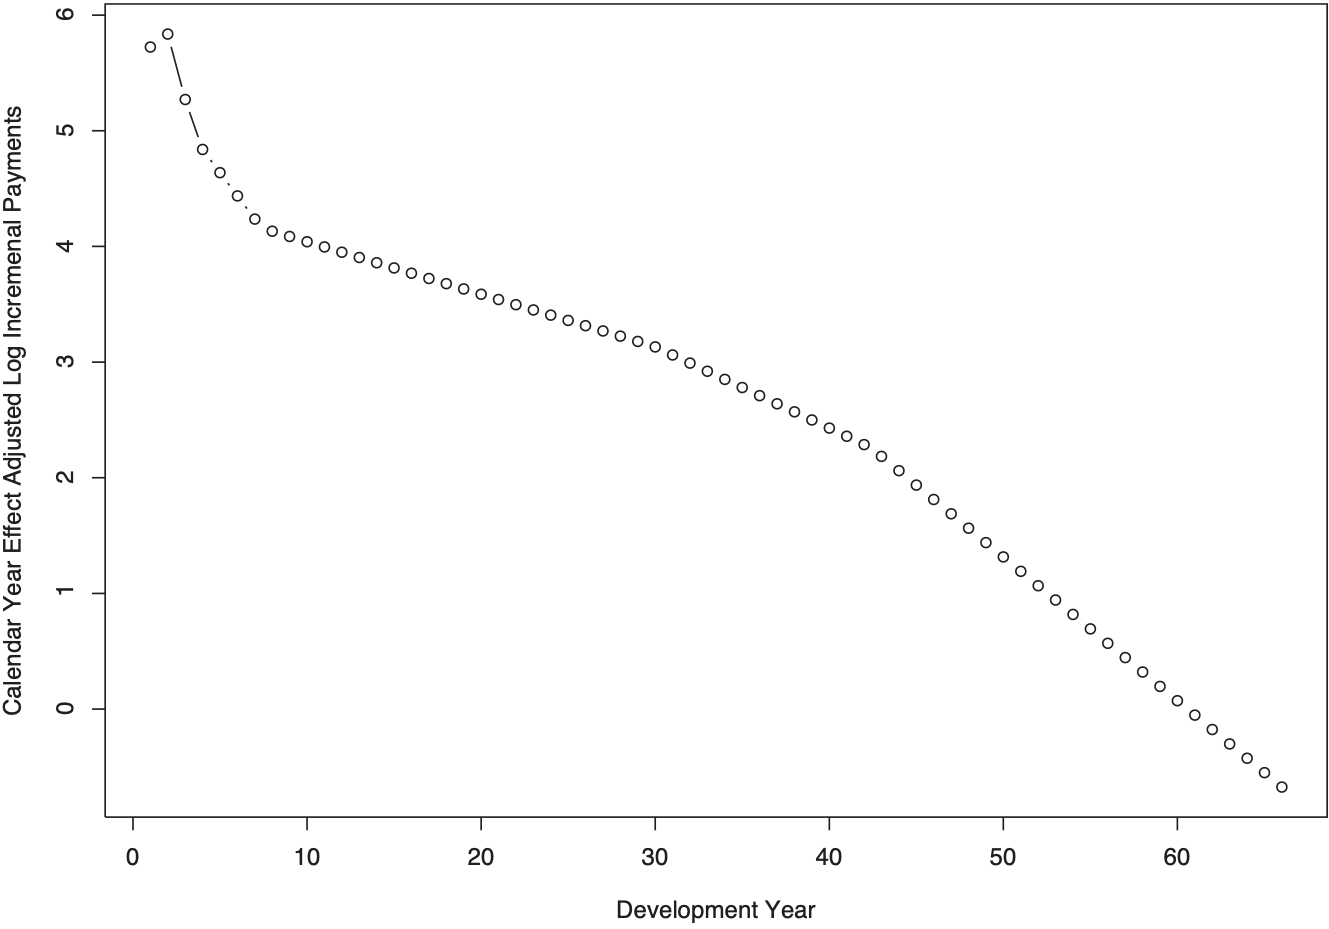
Figure 5 displays (in logarithmic form) the estimated consumption path of indemnity services for the cohort of claimants. By definition, the consumption of indemnity services refers to incremental payments that are adjusted for calendar year effects (and, thus, net of cost-of-living adjustments, where applicable). Another difference to Figure 4 is that the level of exposure is set at the first accident year; the trajectories of all other accident years are simply parallel shifts of the one displayed in the chart, thus adding no information on the development pattern. Initially, the consumption of indemnity services increases (from development year 1 to development year 2), before decreasing monotonically thereafter. This subsequent decline is to be expected, since indemnity services do not lend themselves to utilization increases. At high maturities, indemnity payments typically end with death or, where applicable, are reduced by social security offsets. (No social security offsets apply in the state of Arizona during the studied timeframe.) It is thus not surprising that the rates of decay of the consumption of indemnity services, which are displayed in Figure 6, are correlated with the rate of mortality. The estimated values of these decay rates are provided in Appendix B.

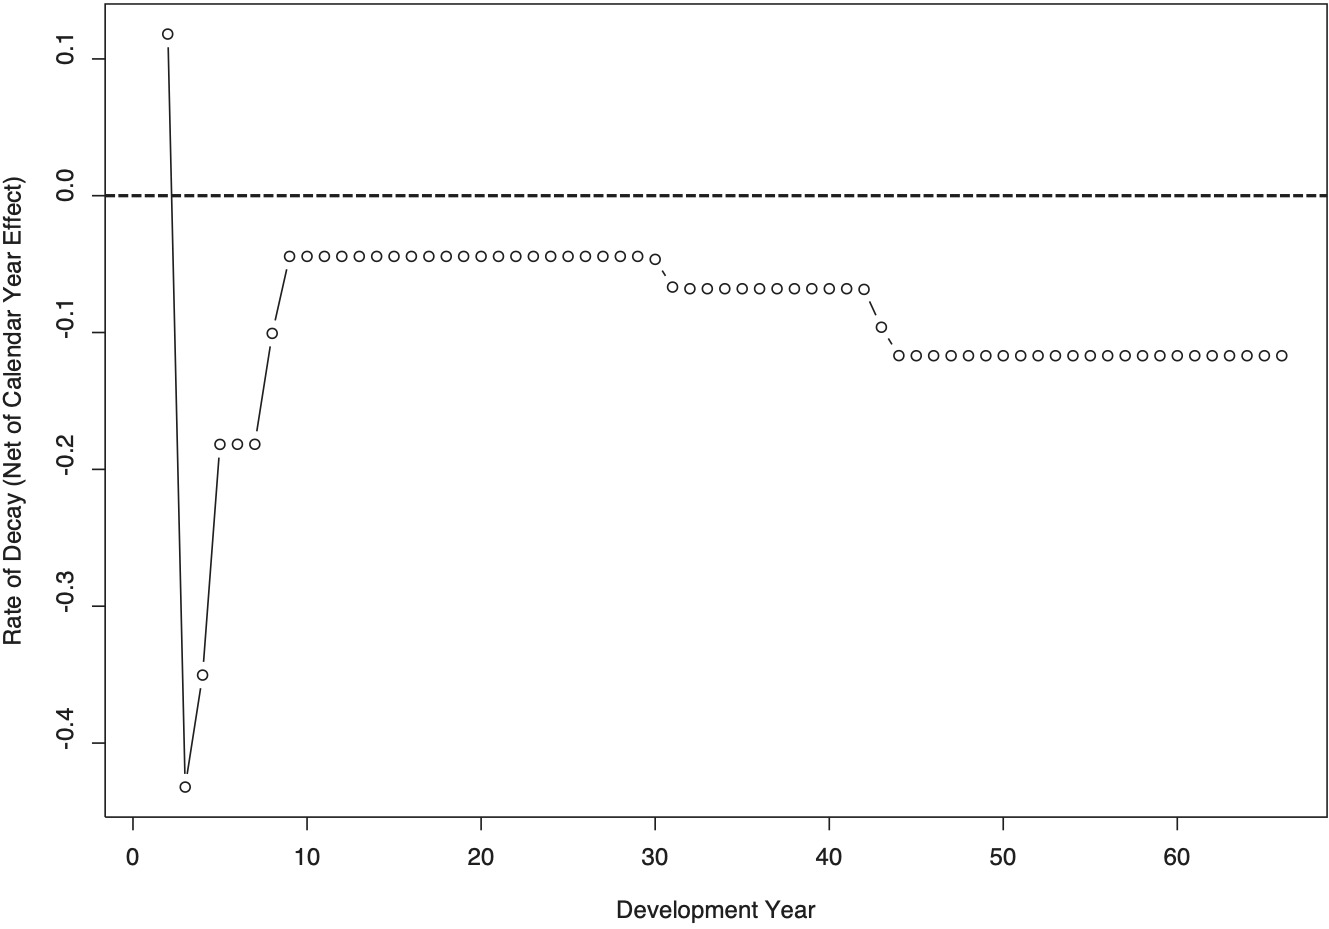
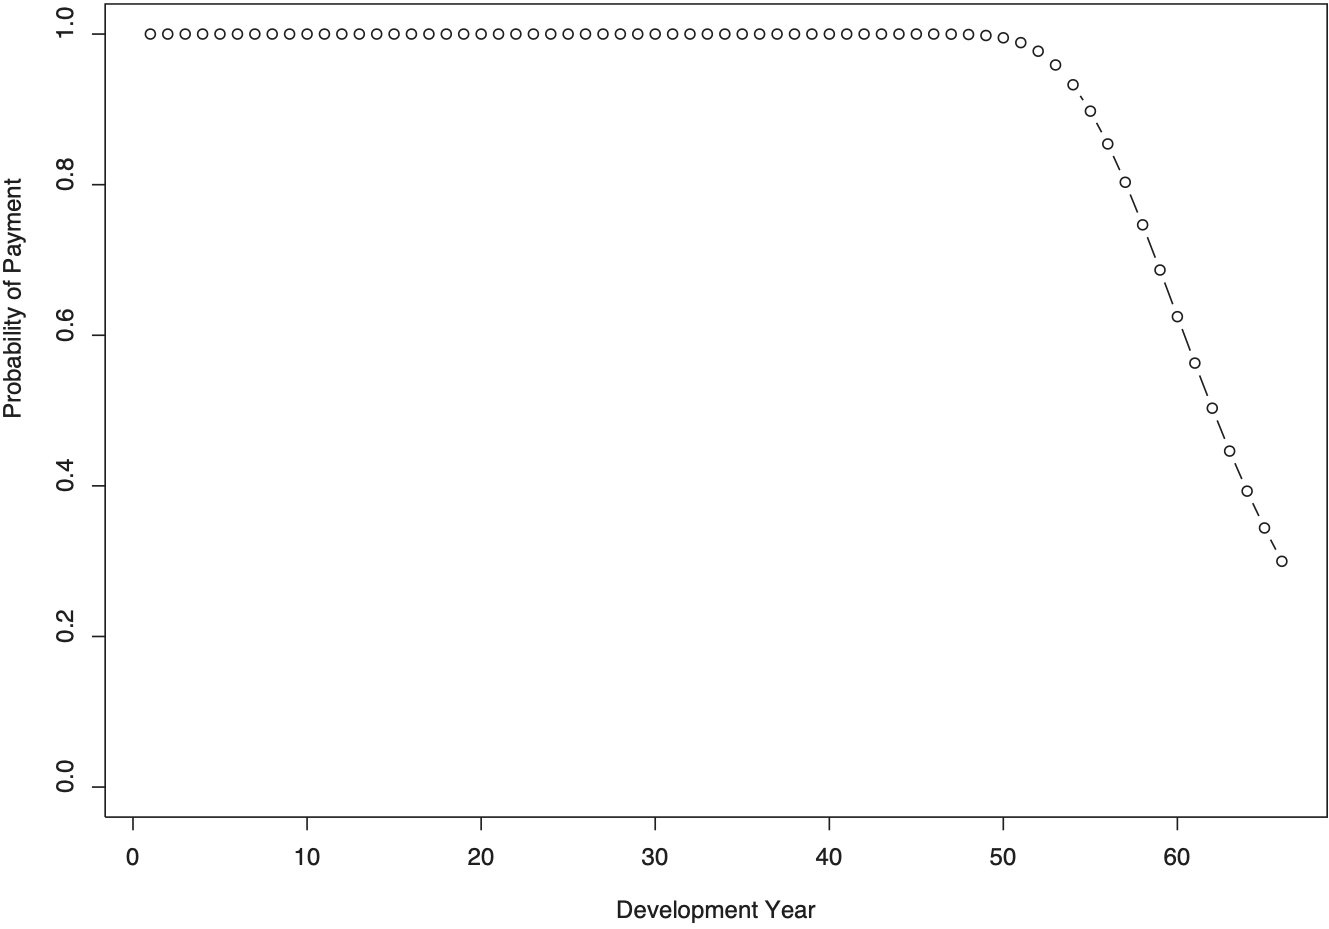
Figure 7 shows the estimated probability of there being an incremental payment in a given development year. As the chart demonstrates, for early development years, the probability of observing a non-zero indemnity payment is essentially unity. This probability starts declining in a meaningful way shortly before development year 50. At the final observed development year (year 66), the probability of observing a non-zero incremental payment is still around 30 percent. Clearly, the decline of this probability is driven by the high development years and, hence, by the early accident years. As a consequence, this probability is greatly influenced by the comparatively low volume of the early accident years and by the mortality rates of the claimants that sustained injuries in those early years. All else being equal, the higher the number of claimants of a given accident year is and the higher the longevity of this cohort of claimants is, the higher is the probability of observing a payment in a given development year. Hence, for the purpose of simulating ultimate losses of more recent (or future) accident years, this trajectory of the probability of payment may need to be shifted to the right.

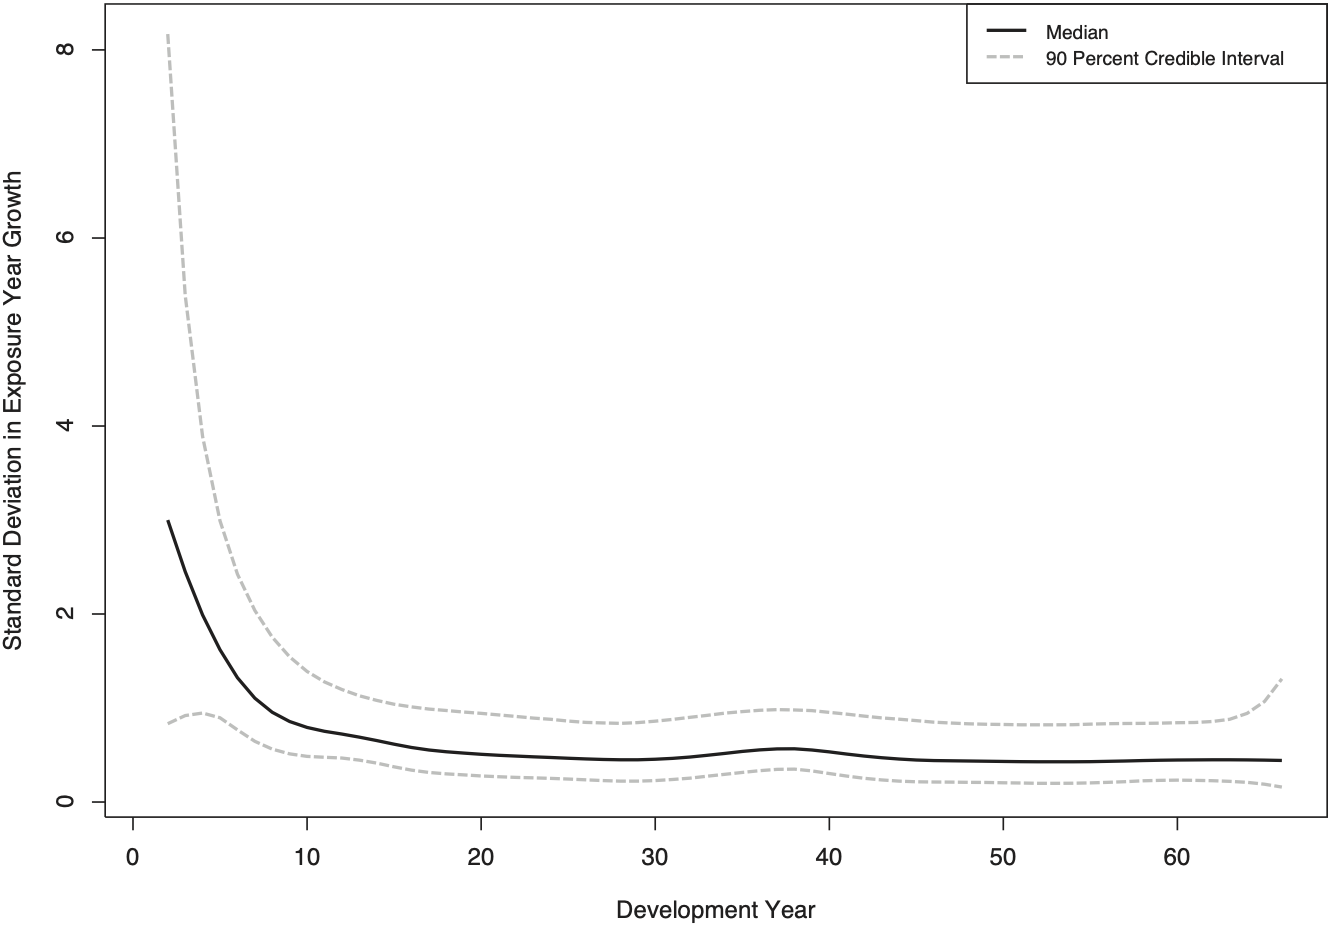
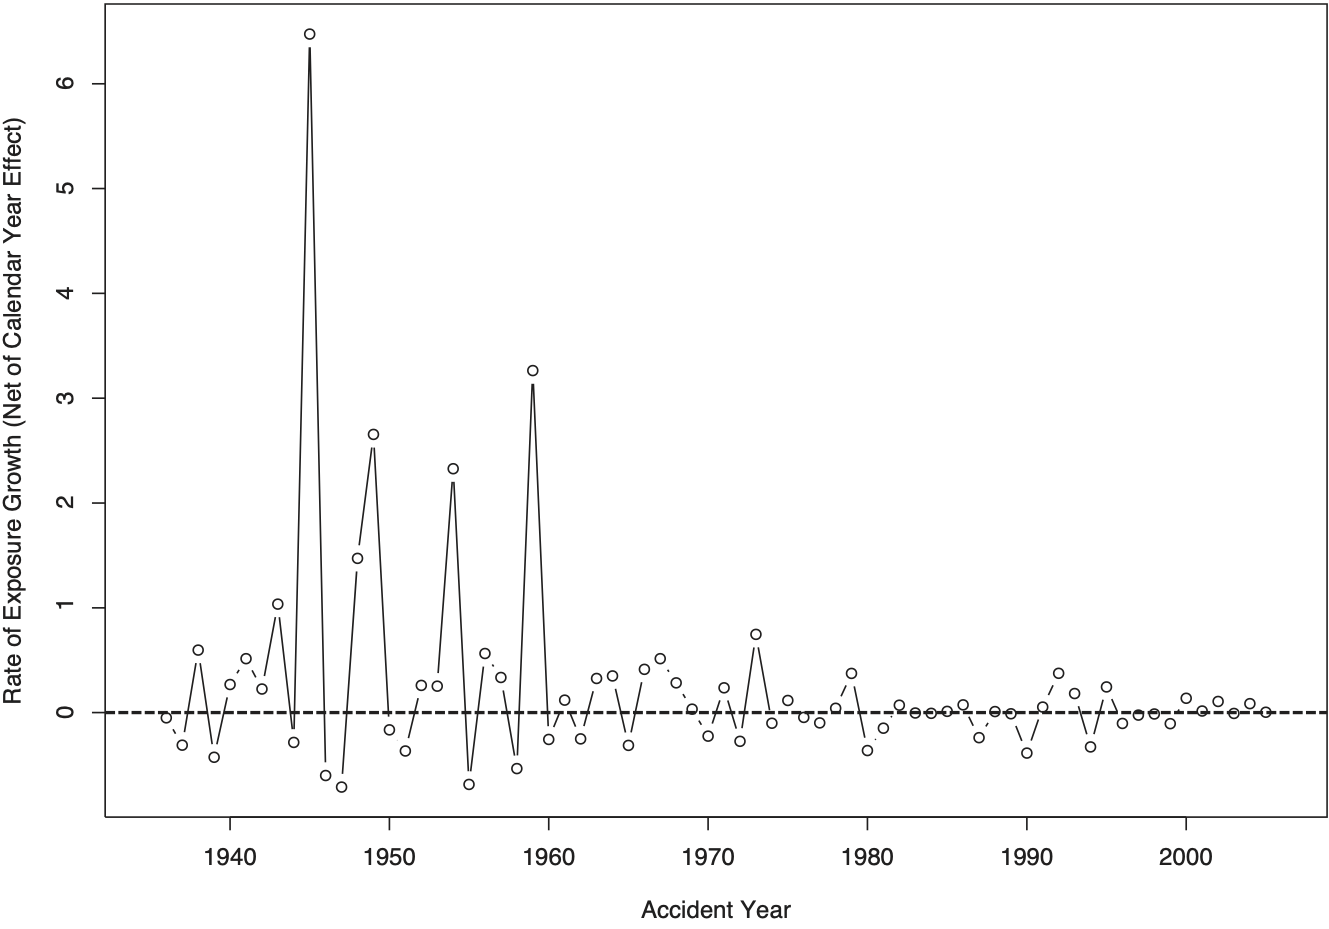
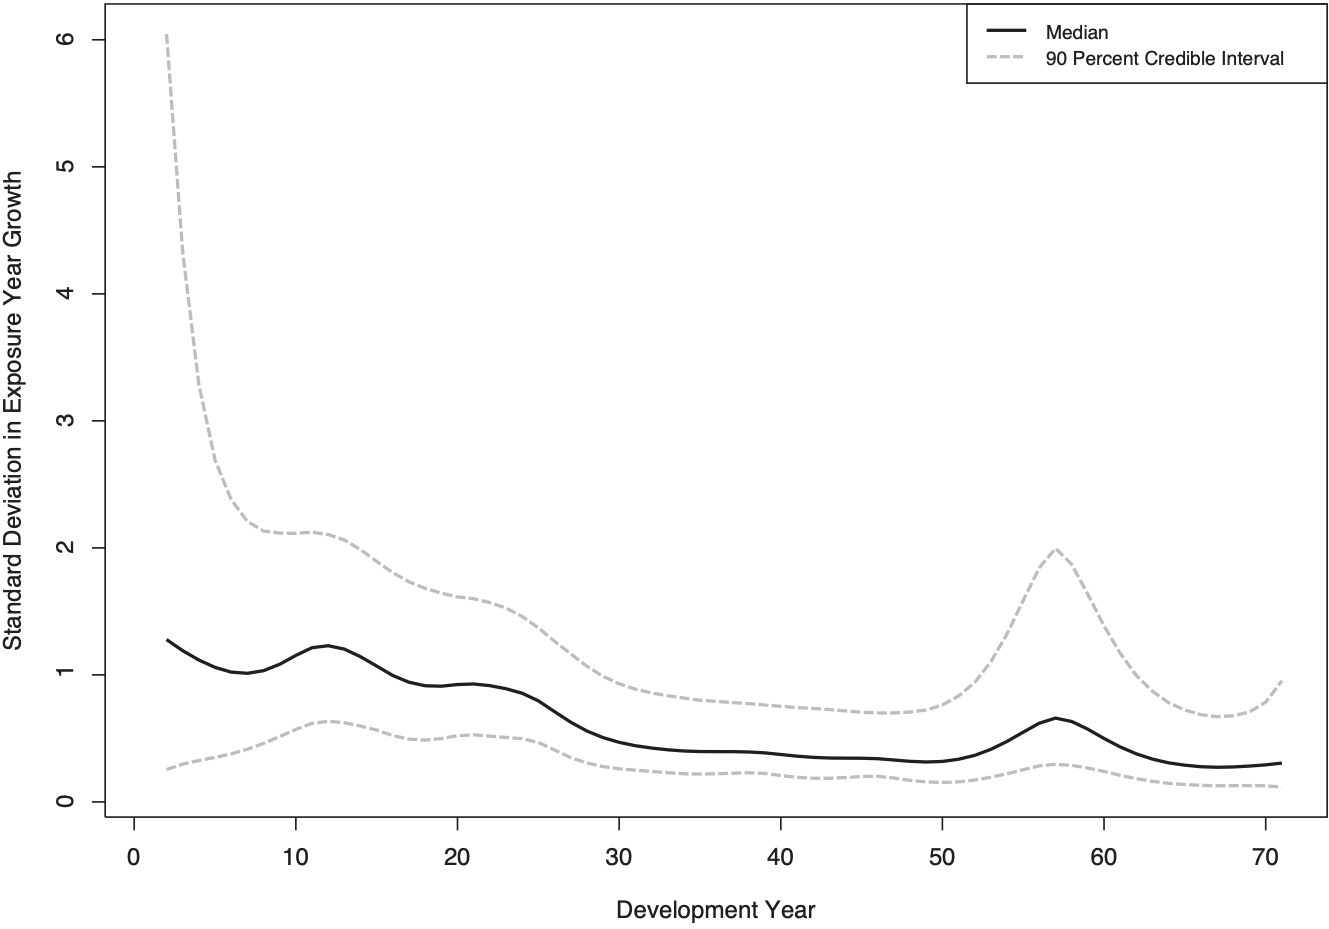
Figure 8 exhibits the rates of exposure growth. These growth rates are highly variable in the early accident years, possibly due to the comparatively small base or incomplete data. Most notable is a nearly 1,500 percent increase in accident year 1942; this spike in the growth rate follows an accident year with only two recorded payments, one of which is comparatively small (and positive) and the other one is negative. In more recent accident years, the rate of exposure growth is relatively small and smooth. As discussed, the rate of exposure growth was modeled using a normal distribution; the square of the scale parameter of this normal distribution was smoothed (in logarithmic terms) across time using a second-order random walk. Figure 9 displays this scale parameter, alongside 90 percent credible intervals, the bounds of which are subject to the degree of smoothing.

.png)
Figure 10 displays the calendar year effect. For the time frame studied here, there was no legally stipulated cost-of-living adjustment of indemnity benefits in Arizona. As a result, the expert prior for the calendar year effect is set to zero; in the chart, this prior is labeled official rate of inflation. Prior to calendar year 1981, the posterior median for the calendar year effect differs from this expert prior only by the sampling error, because the corresponding diagonals are not populated (but instead display missing values). The fully populated diagonals of the time window 1988–2003 exhibit calendar year effects between a negative four percent and a positive ten percent. Past the final observed diagonal, the calendar year effect is simulated from the posterior distribution, as estimated from the preceding set of diagonals.
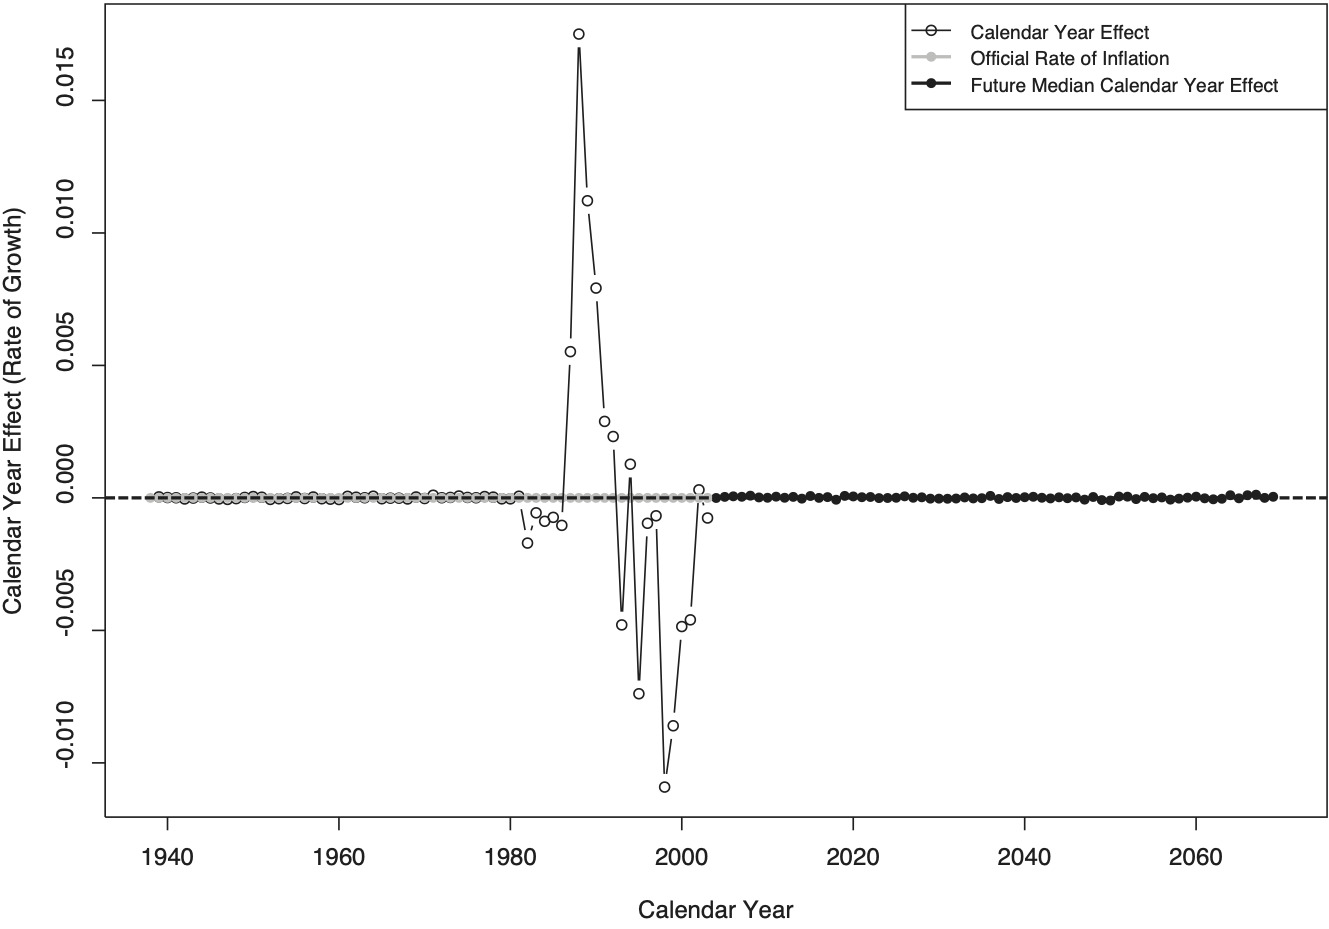
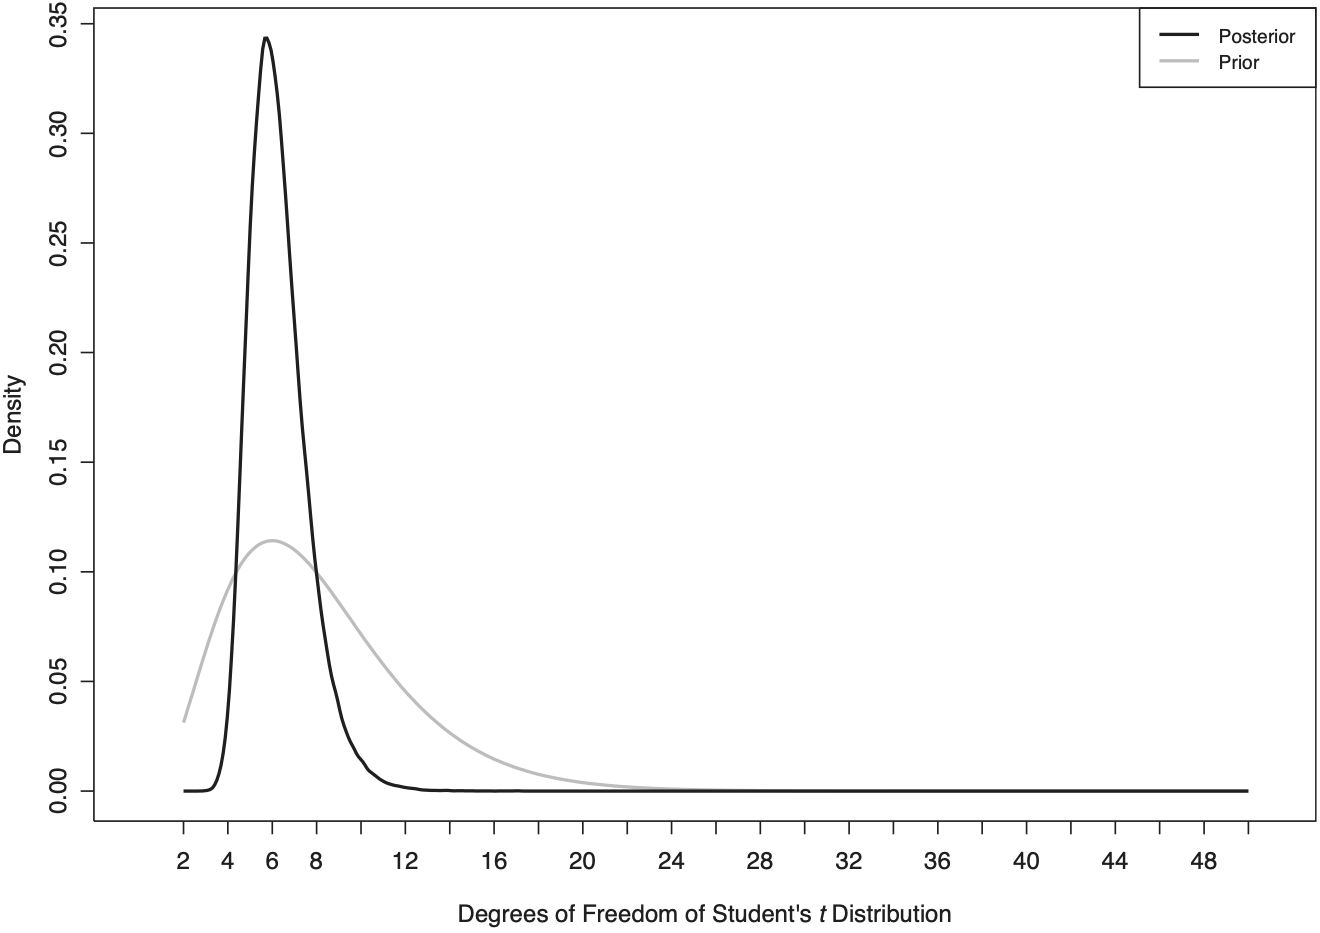
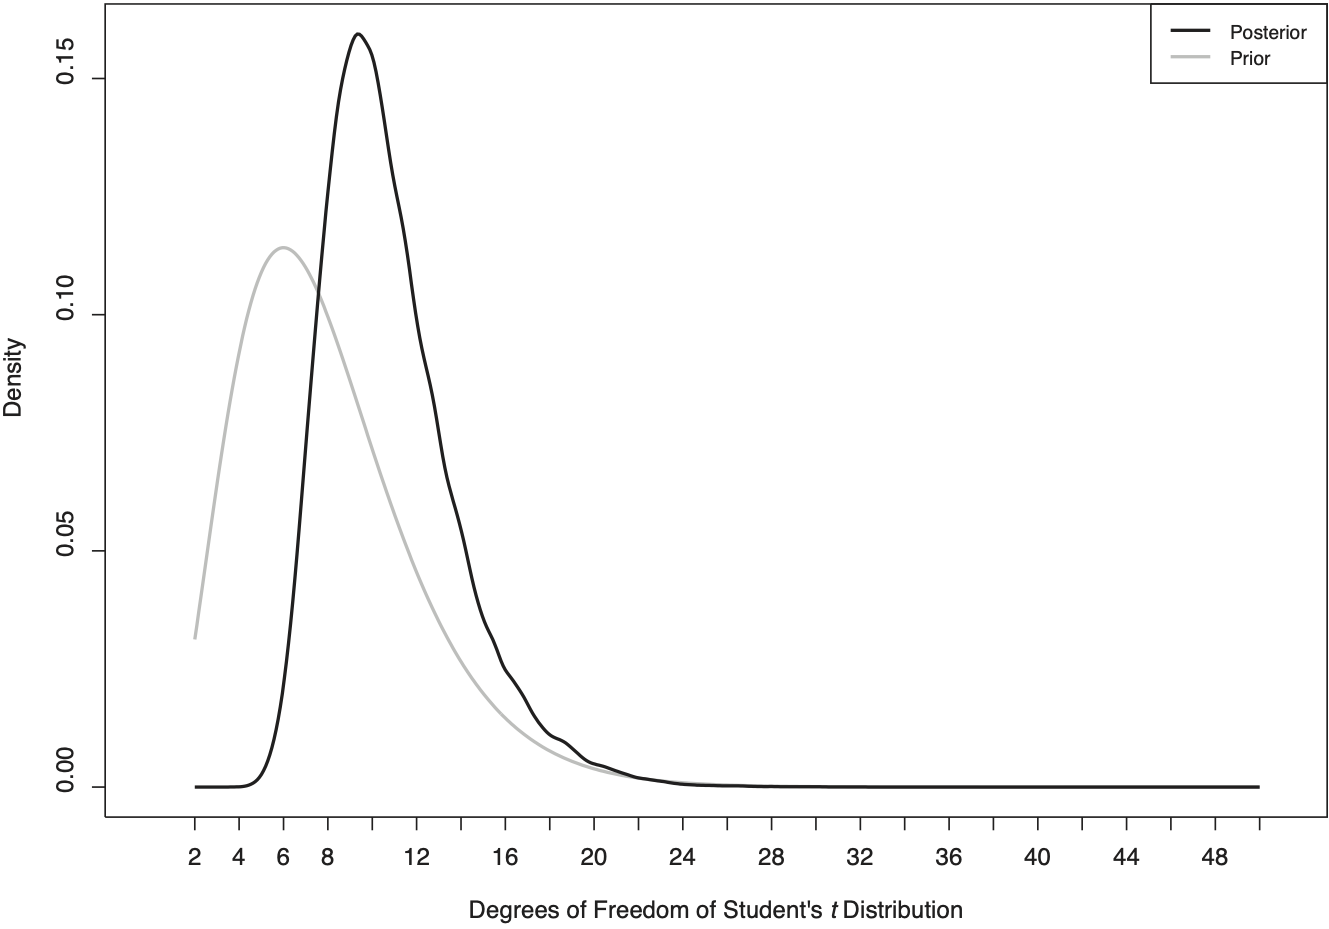
Figure 11 presents the prior and posterior distributions for the degrees of freedom of Student’s t distribution, which is employed in the likelihood that models the logarithmic incremental payments. As mentioned, the prior is a χ2(8) distribution that is truncated at 2 and 50. The posterior distribution displays a mode of around v = 5 degrees of freedom, which attests to very heavy tails.

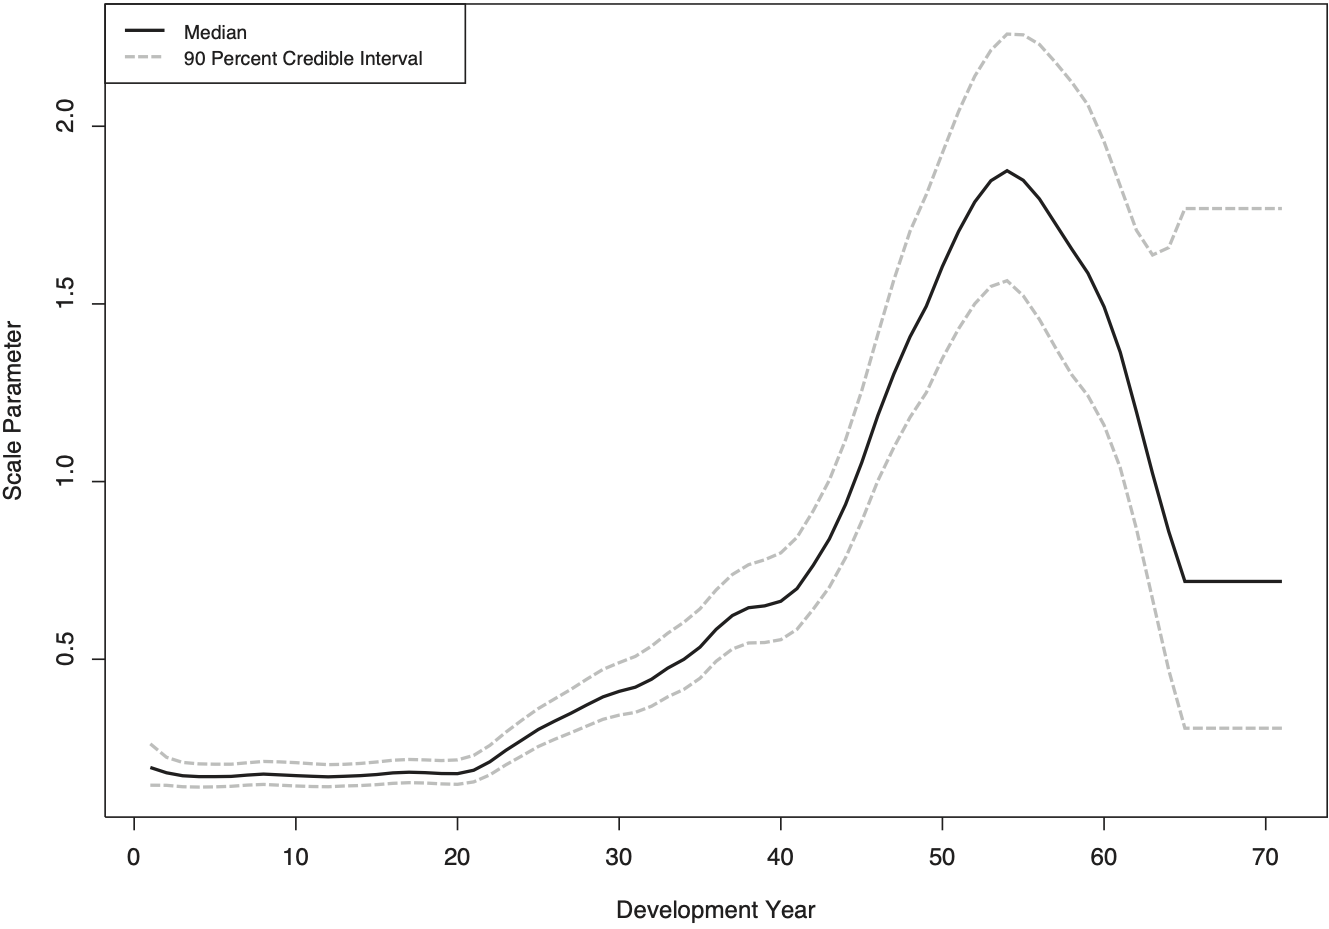
Figure 12 shows the estimates of the scale parameter of Student’s distribution, the logarithm of the square of this scale parameter was smoothed using a second-order random walk. As suggested by the display of the observed logarithmic payments in Figure 4, the variance of the logarithmic incremental payments increases as the cohort of claimants ages; this is because the number of claimants that contribute to the incremental payments decreases. Not surprisingly, Figure 12 reveals a substantial increase in the scale parameter, which grows to about six times its original value (σ1) as development time progresses.

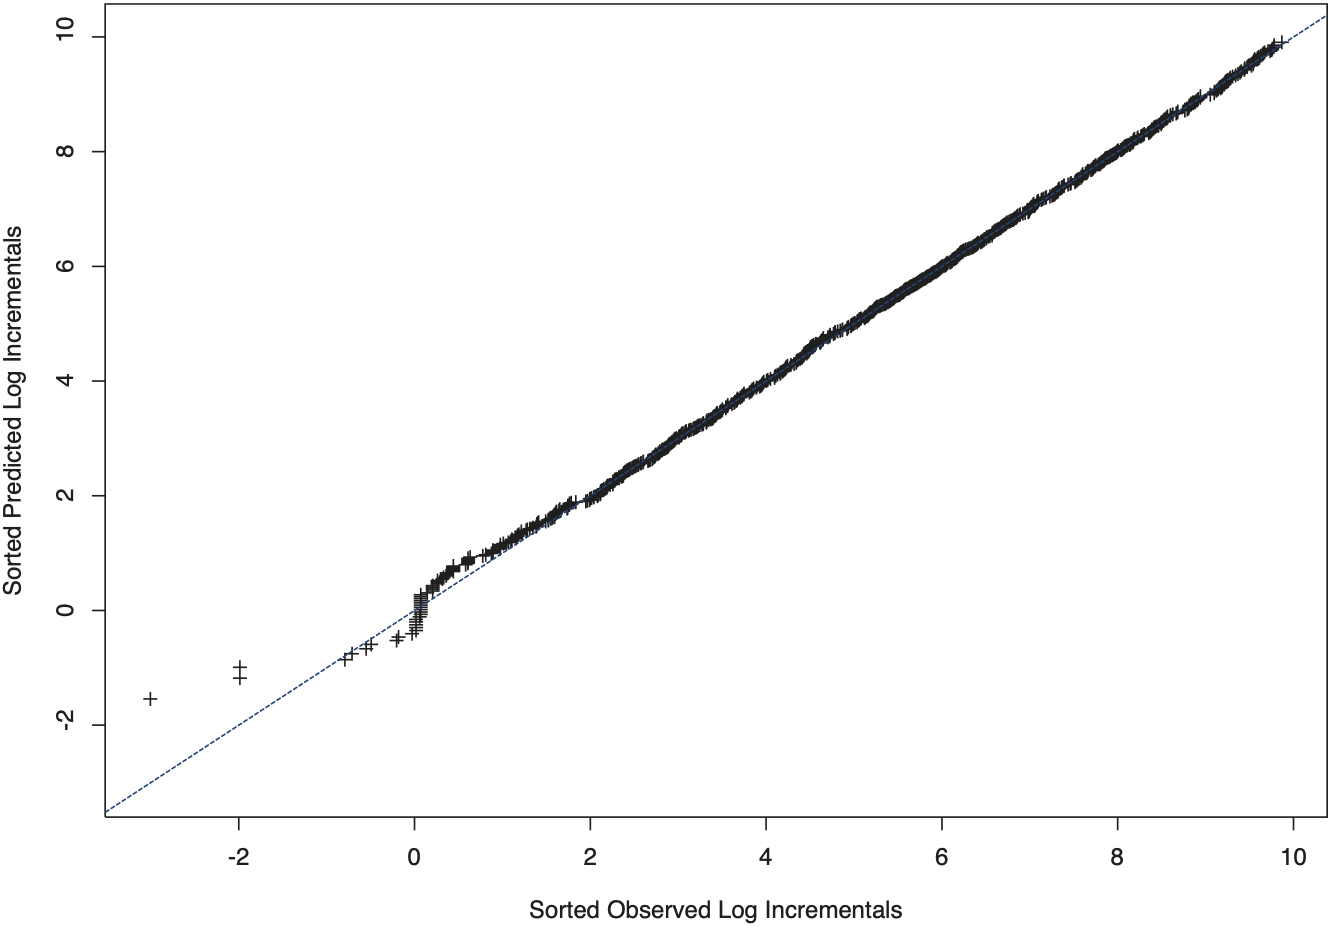
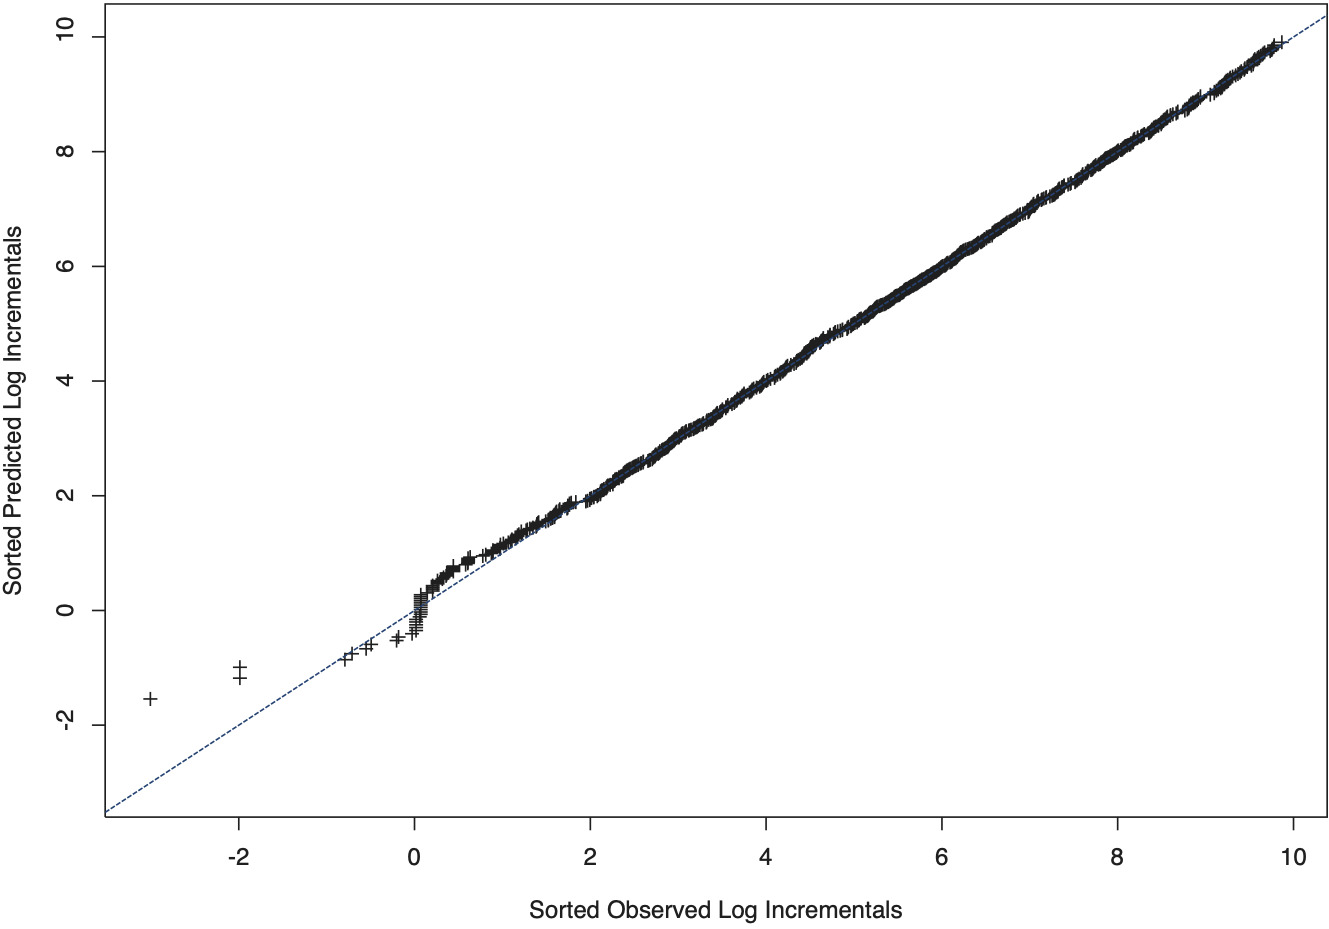
Figure 13 plots the observed logarithmic payments (yi,j) against the estimated quantiles of the predicated logarithmic incremental payments; this is to gauge the ability of the model to replicate the empirical distribution. At each draw from the posterior, the predicted values (i,j) were sorted; the chart displays the medians of these sorted values (or, equivalently, estimates of quantiles), which were plotted against the sorted observed values. Most importantly, the chart indicates that the heavy tails of the empirical distributions have been well replicated and that there is no discernible unexplained skewness in the data.
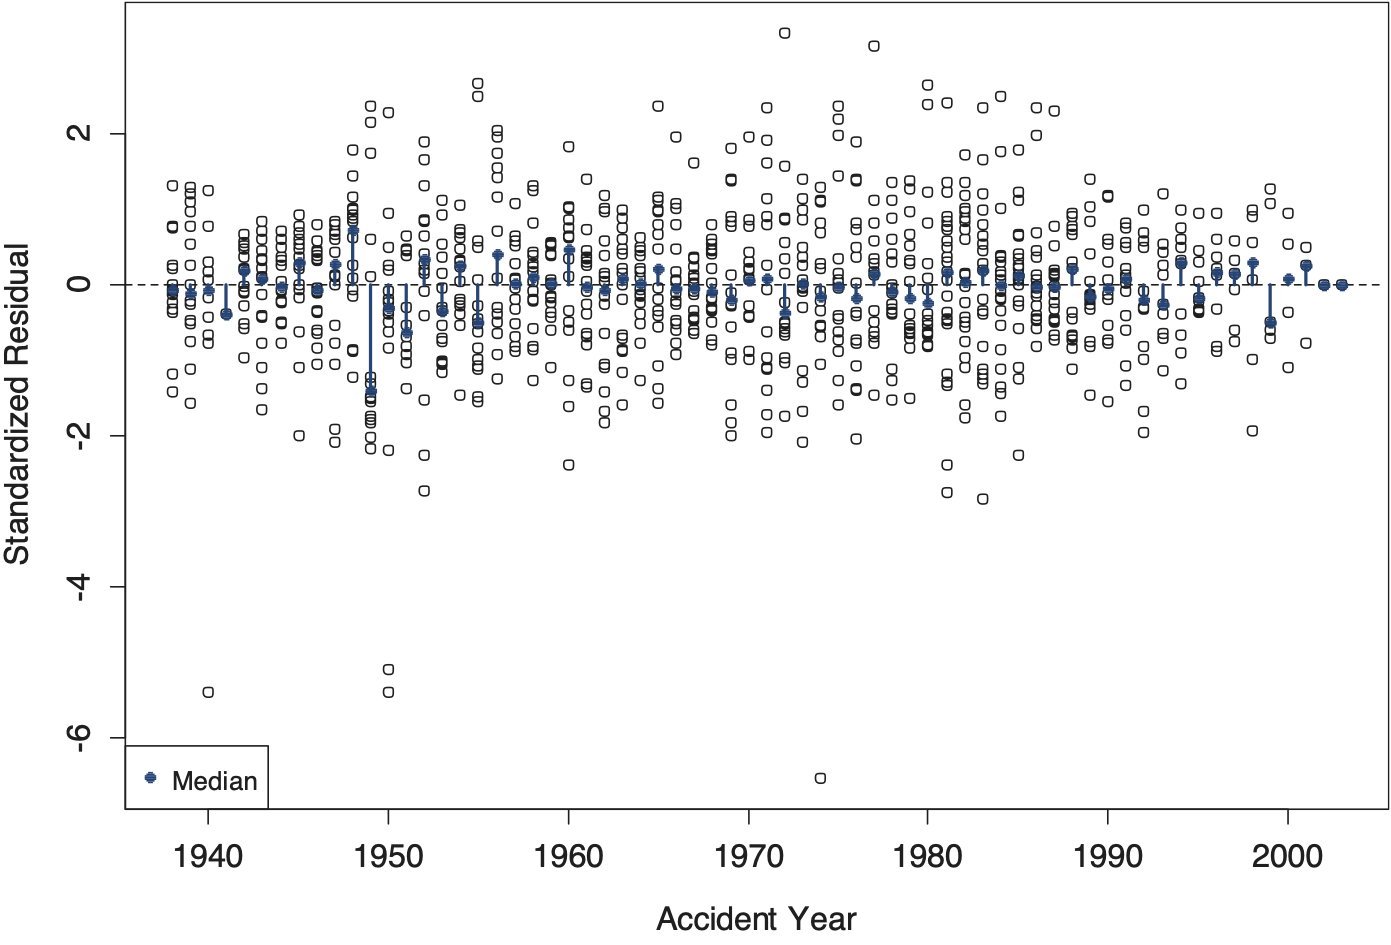
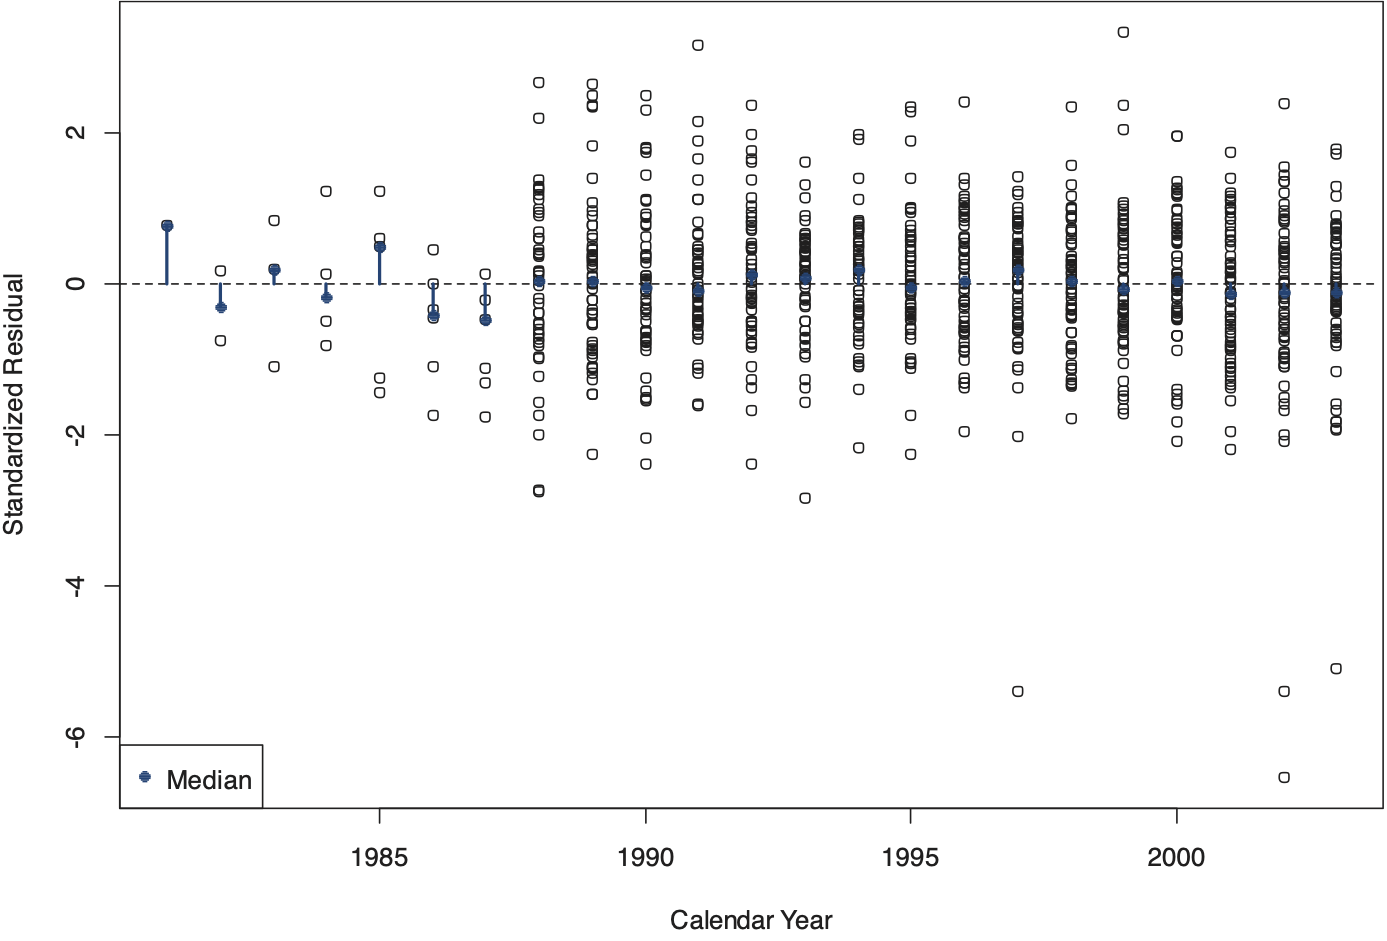
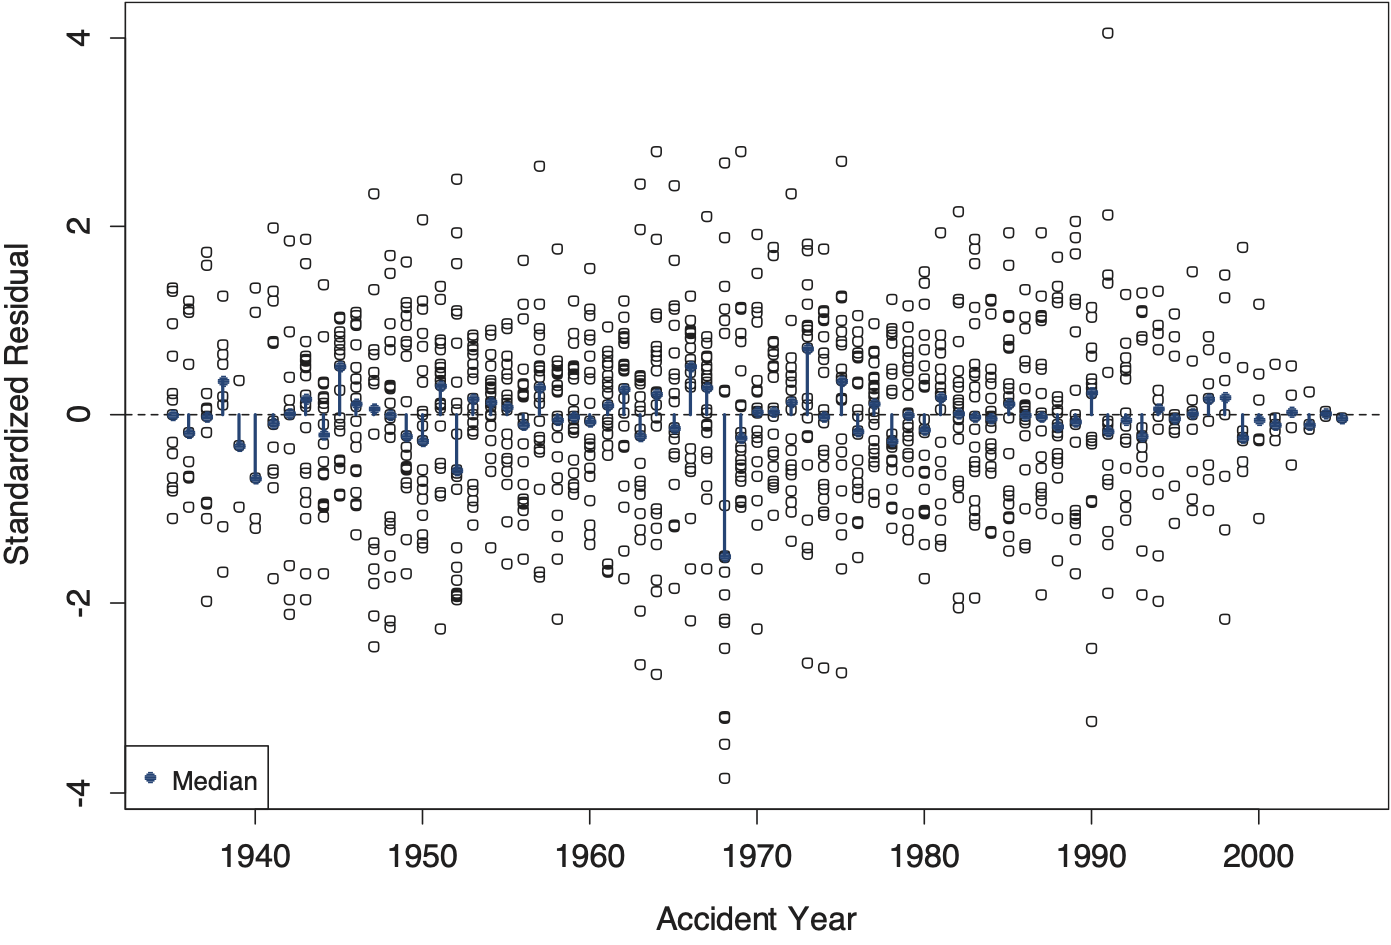
Figures 14 through 16 are diagnostic charts that display standardized residuals along the three time axes of the triangle (Figure 14: development year; Figure 15: accident year; Figure 16: calendar year). These standardized residuals are defined as follows (see, for instance, Meyer and Yu 2000):
\frac{y_{i, j}-\mu_{i, j}}{\sigma_{j} \cdot \sqrt{\frac{\mathbf{v}}{\mathbf{v}-2}}} \tag{7}


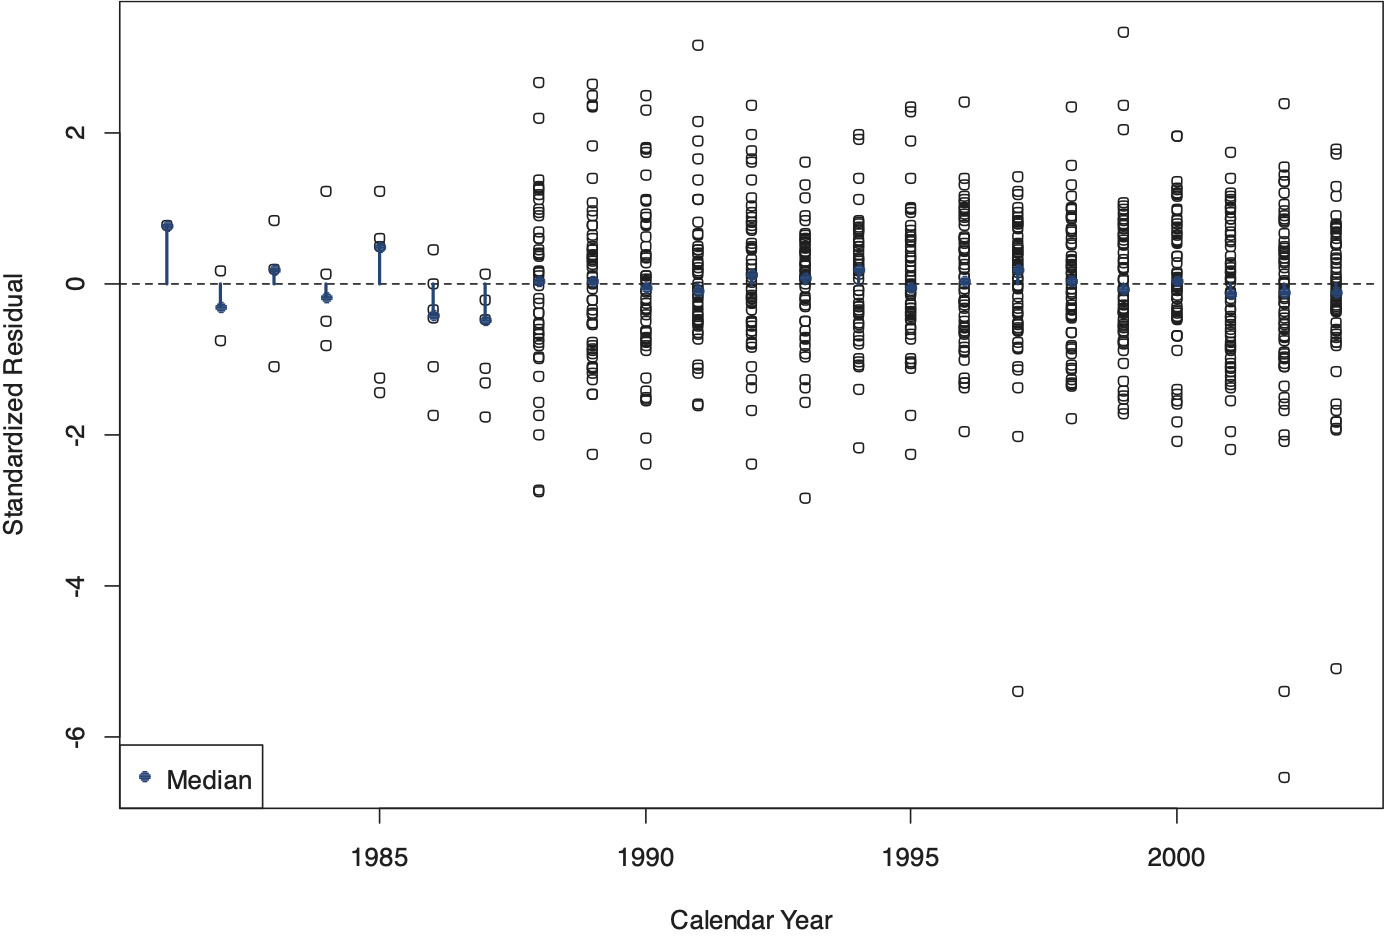
The standardized residuals were calculated draw by draw; the charts display the means across the sampled values. The median values of the residuals of a given (development, accident, or calendar) year are indicated by pins with solid pinheads. In a well-calibrated model, these median values show no systematic deviation from zero on the horizontal time axis. Further, with proper adjustment for heteroskedasticity, the variance of these standardized residuals must be uniform on the time axis, which appears to be the case also.
3.2. Empirical evidence for the SAIF Oregon PD medical triangle
The SAIF Oregon accident year triangle comprises 80 years of development of the medical component of PD claims; the accident years run from 1926 through 2005. Sherman and Diss (2006) studied an earlier vintage of this triangle.
Appendix A offers a schematic exposition of the SAIF Oregon triangle. Similar to the SCF Arizona triangle, the SAIF triangle has a large upper left-hand side section of missing values; the first fully populated diagonal of the SAIF triangle falls into calendar year 1985. Due to the sparseness of the data, the first nine accident years (1926–1934) are discarded, thereby reducing the triangle to 71 development years. Starting in development year 42, the triangle is characterized by a high and increasing number of observations with zero payments; past development year 67, all payments are equal to zero.
In 1990, the Oregon Legislature, in special session, made significant changes to the existing Workers’ Compensation Law (SB 1197). This legislative reform may have contributed to a structural break in the consumption path of medical services, potentially by quickening the decay of consumption in the early development years. In order to account for such a potential structural break, the break version of the model is applied. Because the legislative reform occurred in midyear, the Bayesian prior for the location of the change point allocates the same 50 percent probability to the years 1990 and 1991. The empirical results for the SAIF Oregon PD medical triangle are summarized in Figures 17 through 28.
_and_estimated_(lines)_logarithmic_incremental_payments.png)
Figure 17 displays in logarithmic terms the incremental payments, as observed (indicated by circles) and predicted (indicated by lines; each line represents one accident year). Again, in this chart, predicted values are reported only for positive log incremental payments, as indicated by breaks in the lines. In this triangle, accident years comprise at most 21 observations (except for accident year 1984, which consists of 22 observations). The sets of incremental payments of older accident years tend to start farther to the right and, due to the typically lower volumes of those early years, tend to follow lower trajectories. There is a noticeable increase in the variance of the logarithmic incremental payments as development progresses. Also, as development progresses past development year 20, the lines that represent individual accident years are approximately horizontal; for some accident years, the incremental payments increase slightly over time, whereas for others they decrease somewhat.
Figure 18 presents in logarithmic terms the pre-reform consumption path (gray trajectory) and the post-reform consumption path (black trajectory) of medical services (at the exposure level of the first accident year in the triangle). Consumption of medical services is measured by calendar year effect-adjusted incremental payments. Initially (i.e., from development year 1 to development year 2), consumption increases before decreasing continually in all subsequent development years. Following the 1990 reform, initial exposure-adjusted consumption is slightly higher, but decays faster than before the reform. In the chart, the post-reform consumption path ends with the final development year represented in the time interval of the structural break.

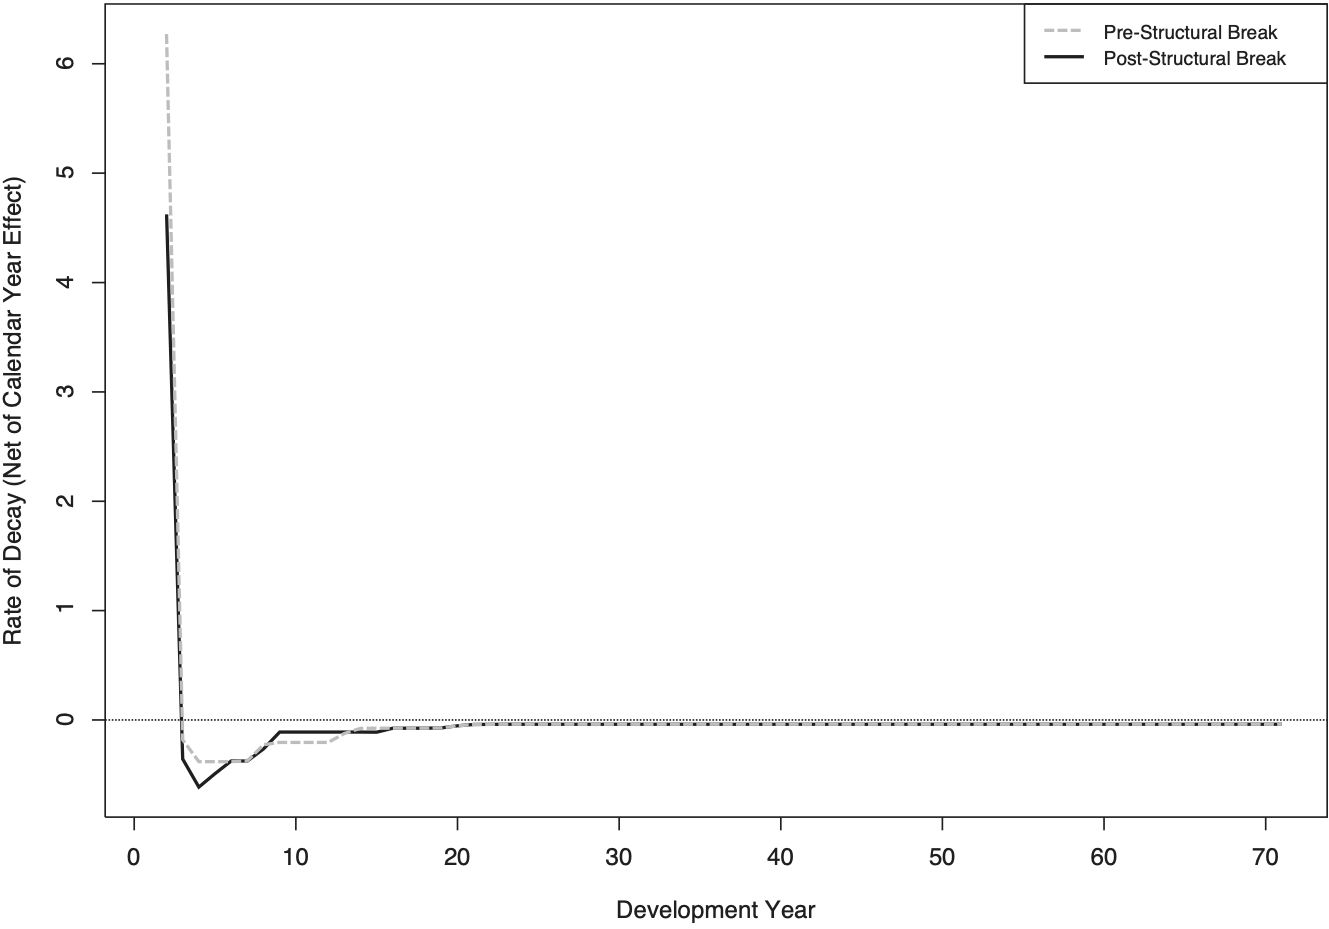
Figure 19 exhibits the pre- and post-reform decay rates of the consumption of medical services. Figure 20 offers a detailed view of these growth rates, starting with the third value. The premise of quantifying a structural break in the decay rate is that the post-reform rate approaches the pre-reform rate as development progresses. This is because, as a cohort of claimants ages, the growth rate of consumption (but not necessarily the level of consumption) can be assumed as increasingly unrelated to the reform and instead increasingly related to mortality. Based on this argument, the trajectory of the post-reform decay rate merges with the pre-reform decay rate where the post-reform consumption path ends.


Most interestingly, the decay rate displayed in Figures 19 and 20 stabilizes at a negative 3.93 percent in development year 23. This stationarity after about 22 development years offers an important insight: Generalized to smaller medical triangles (e.g., 30 development years), the estimated decay rate at the final development year may serve as the basis for projecting the consumption path at higher maturities. Appendix B displays the numerical values of the estimated pre-reform and post-reform decay rates.
If, in logarithmic terms, the absolute value of the rate of decay is less than the absolute value of the rate at which claimants leave the cohort, then this implies that the remaining claimants are increasing their consumption. Put differently, although the consumption of medical services decreases for the cohort, the individual claimant’s consumption may increase. In such a situation, an increase in the absolute value of the rate of mortality, as is associated with the aging of a cohort of claimants, implies that the surviving claimants are increasing their consumption at an ever higher rate.
Figure 21 displays the probability of there being a payment in a given development year. The disclaimer made in conjunction with the SCF Arizona indemnity triangle regarding the role of this trajectory for simulated ultimate losses of more recent or future accident years applies here, too.

Figure 22 exhibits the rates of exposure growth. As with the SCF Arizona indemnity triangle, these growth rates are highly variable in the early accident years, but comparatively small and smooth in more recent accident years. Most remarkable is the close to 600 percent increase in exposure in the year 1945, which coincided with World War II veterans rejoining the workforce. Several more but smaller spikes in exposure growth were observed in the following two decades. The displayed rates of exposure growth were affected by the general growth of the economy and by legislative changes. Whereas through 1965, workers compensation benefits in Oregon were paid out of the Industrial Accident Fund, effective January 1, 1966, employers could choose to self-insure, insure with private companies, or stay with the Fund, which is now known as SAIF. Figure 23 shows how the scale parameter of the normal distribution that models exposure growth has declined over time, which is consistent with the smoother and, in absolute value terms, smaller observed rates of growth.

.png)
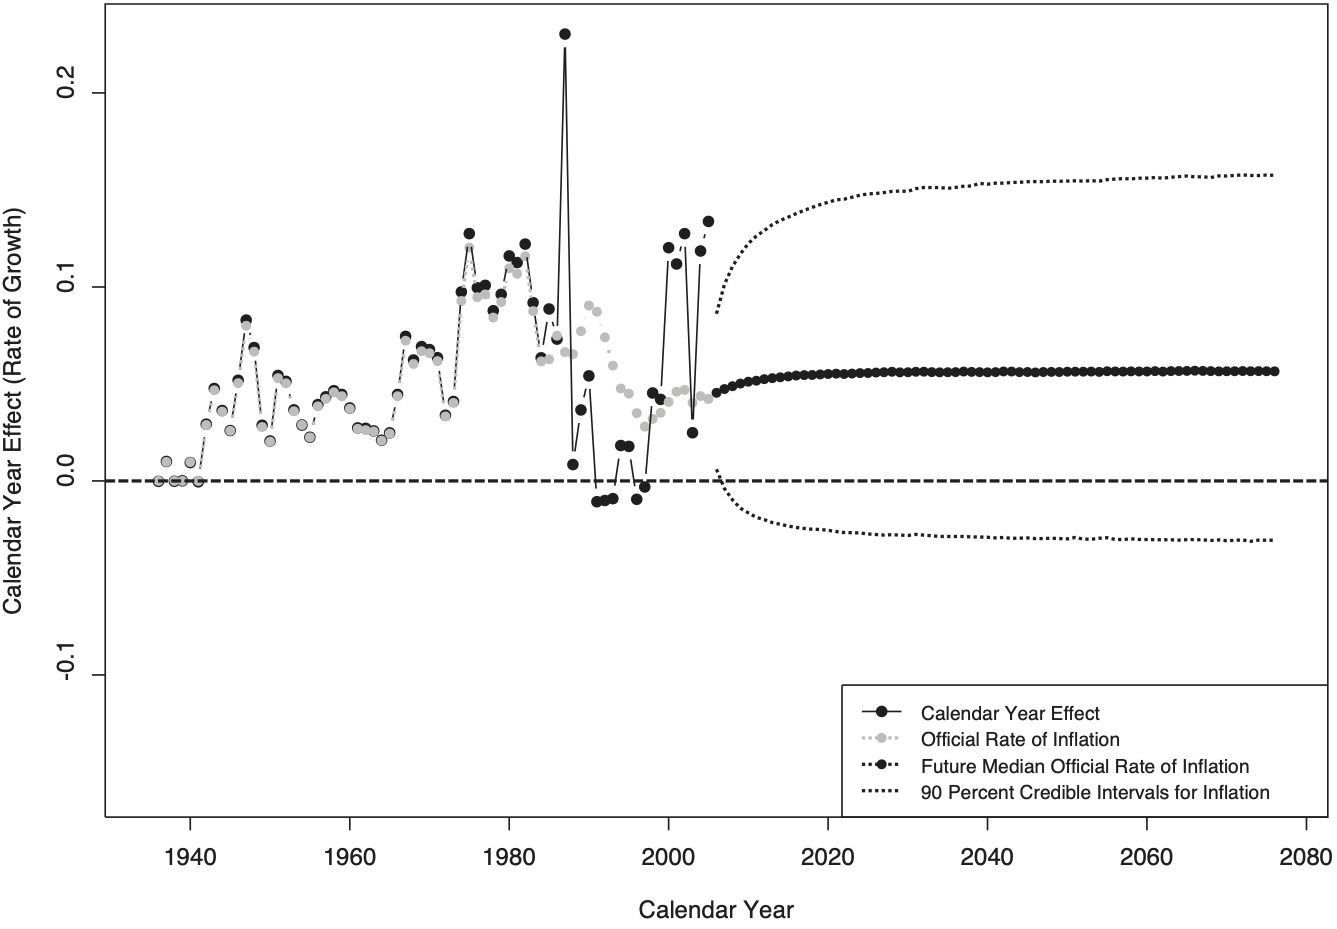
Figure 24 displays the calendar year effect. Prior to calendar year 1984, the posterior median for the calendar year effect differs from the rate of M-CPI inflation only by the sampling error; this is because no incremental payments are available for these diagonals and, hence, no calendar year effect can be estimated. The fully populated diagonals of the time window 1985–2005 exhibit calendar year effects that are several percentage points above or below the rate of M-CPI inflation, which is labeled official rate of inflation in the chart; some of these calendar year effects are negative. Future calendar year effects are simulated using the Ornstein-Uhlenbeck process (which has been calibrated to annual data from 1935 through 2005) and the posterior distribution around this effect. The simulated mean-reverting path of M-CPI inflation is shown by a solid black line; this line increases as it approaches the historical average asymptotically because the M-CPI rate of inflation for 2005 is below the historical average (as recorded through 2005). The credible intervals shown in the chart refer to the rate of M-CPI inflation only, not to the total calendar year effect.

Figure 25 presents the prior and posterior distributions for the degrees of freedom of Student’s t distribution. As with the SCF Arizona indemnity triangle, the low degrees of freedom are indicative of heavy tails.

Figure 26 displays the estimates of the scale parameter of Student’s t distribution. As with the SCF Arizona triangle, the variance of incremental payments increases with development time but, contrary to the SAIF triangle, this variance shows a decline at very high maturities, i.e., before the triangle runs out of payments.

Figure 27 plots the observed logarithmic payments (yi,j) against the estimated quantiles of the predicated logarithmic incremental payments. Here again, the predicted quantiles line up well with the observed values.

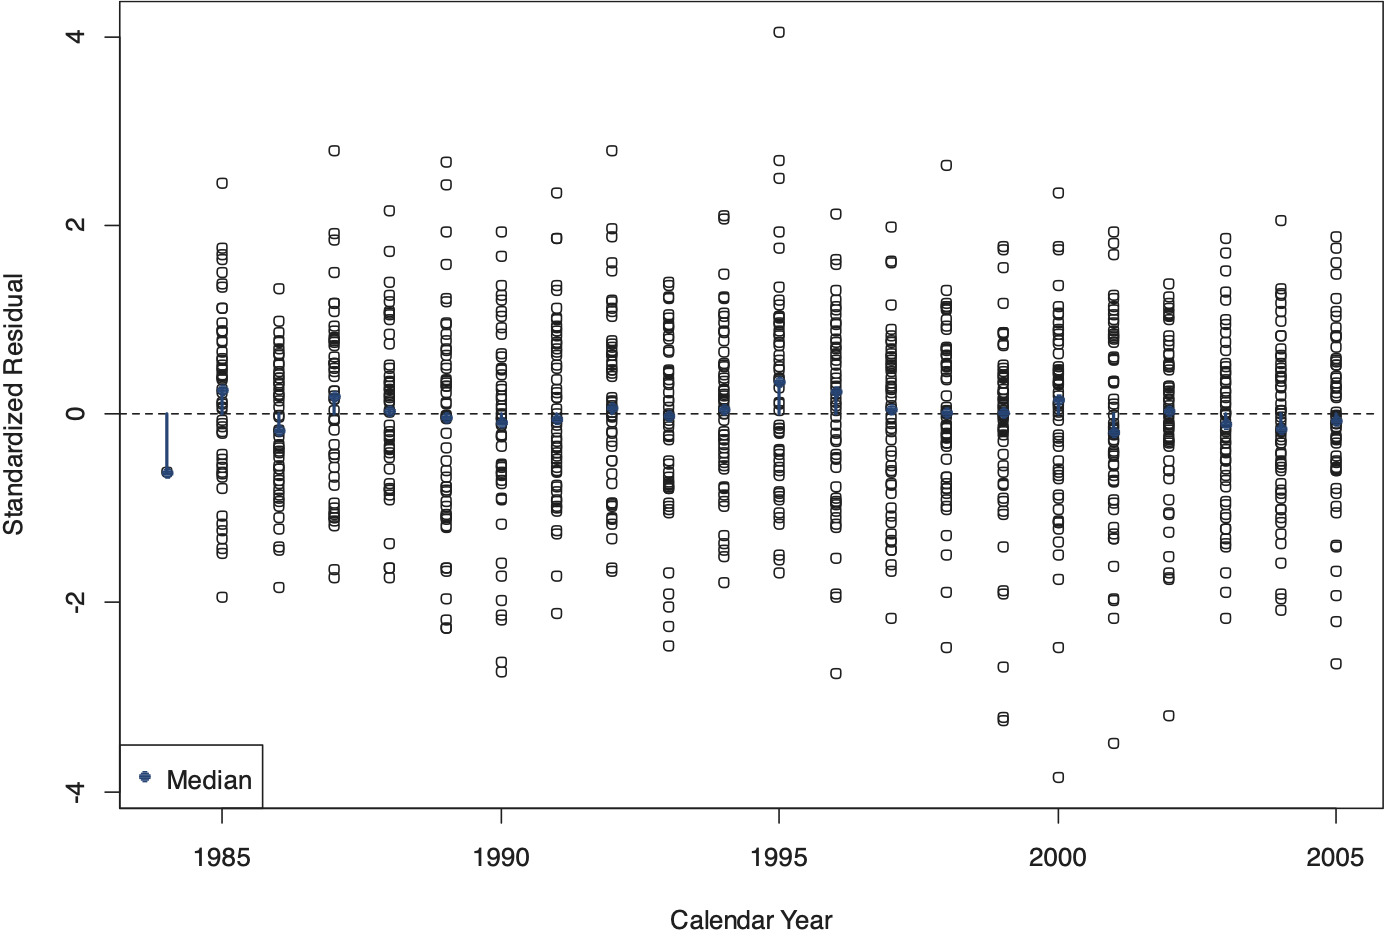
Figures 28 through 30 are the diagnostic charts that display the standardized residuals along the three time axes of the triangle. As with the SCF Arizona triangle, the charts indicate that the model is well-specified; most importantly, Figure 28 suggests that the model is capable of accounting for heteroskedasticity on the development time axis.


4. Conclusion
It has been shown that the rate of decay in the consumption of medical services assumes a stationary, negative value after about 20 development years. This implies that, as a cohort of claimants of a given exposure year ages and its number of members shrinks, there is an acceleration of consumption of medical services on the part of the surviving claimants that offsets the acceleration in the rate of mortality, thus resulting in a constant rate of decay in consumption for the cohort. The analysis does not support the hypothesis posited by Sherman and Diss (2006) that there is a bulge in the incremental medical payments at high maturities.
The stationarity of the rate of decay of medical consumption displayed in Appendix B lends itself to straightforward simulation of the development pattern of incremental payments. These incremental payments must not only account for the rate of decay in consumption, but also for price inflation; depending on which of the forces is stronger, incremental payments may increase with development time. Future rates of inflation may be simulated using an Ornstein-Uhlenbeck process that has been calibrated to the rate of M-CPI inflation over the entire history of this price index series. As discussed, any systematic difference between the (logarithmic) rate of M-CPI inflation and the unobserved (logarithmic) rate of inflation for medical services in workers compensation factors into the (logarithmic) rate of decay of consumption of medical services and, hence, is of no concern so long as the relation between these two rates of price inflation can be assumed to be stable.
Finally, it has been shown that legislative reforms, such as the 1990 cost containment reforms implemented in Oregon, may accelerate the decay in the consumption of medical services. Such accelerated decay may spill over into the indemnity triangle, where it manifests itself in shorter claim durations.
Acknowledgment
The author is grateful to SCF Arizona and SAIF Oregon for providing the loss triangles. Thanks also to Jon Evans, Rick Sherman, and Harry Shuford for comments. Chris Laws, Manuel de la Guardia, and Jose Ramos provided research assistance. Chris Laws wrote the C++ Reversible Jump MCMC add-on to JAGS.
.png)
.png)