1. Introduction
Reinsurance is one of the primary tools available for an insurance company to manage its risk and required capital. To determine the most appropriate structure from an organizational perspective, an economic capital model is typically used to measure the impact of various structures on a particular tail-risk metric versus the cost of ceding that risk to an external party. Normally, the metric used is what regulators deem the required level of capital, such as the 1-in-250-year event.
Reinsurance is also purchased to protect the profitability of individual underwriting teams or lines of business within an organization. This second objective may run counter to the first because it has the potential to cede profit while reducing the benefit of diversification. Simpler performance measures are often used to evaluate reinsurance with this objective, as capital models may lack the granularity to price individual treaties, and decision-makers at this level may be less oriented toward actuarial or financial modeling. These measures include the ceded limit of an individual risk versus the cost or the impact on the expected combined ratio. One of the most prevalent metrics used to estimate the value of quota share reinsurance is the difference between the ceding commission—the portion of ceded premium the cedant retains to cover expenses—and the subject business’s actual expense ratio. When positive, this spread (often referred to as the “risk-free margin” or “override”) is favored for its simplicity and its potentially positive impact on the net combined ratio.
However, a limitation of the risk-free margin is not the metric itself but the manner in which it is calculated. By relying solely on the difference between the ceding commission and expenses, the traditional calculation does not make explicit the amounts of risk and margin being transferred, which are primary economic drivers of reinsurance purchasing decisions. A quota share may also have risk-mitigating features that materially affect ceded risk but are not captured with the traditional formulas, thereby undermining the assumption that the resulting margin is “risk-free.” Moreover, the traditional formula cannot be applied to structures without ceding commissions, such as excess of loss, which may transfer risk at better pricing.
While coefficients of variation, value at risk (VaR), or other statistical metrics can show which treaties provide better economics, decision-makers within underwriting and management teams consistently rely on the risk-free margin because of its ease of interpretation and its ability to show that another market is willing to accept the same risk at a higher cost.
1.1. Research context
The study of optimizing reinsurance has a long history, going back at least to Borch (1960), who demonstrated the efficiency of stop-loss contracts over other structures when using the expected value principle to calculate reinsurance premium. This work was expanded by economists such as Kahn (1961), Arrow (1963, 1974), and Ohlin (1969).
More sophisticated approaches addressing loss variability and expected premium have been developed over the years. Cai and Tan (2007), Cai et al. (2008), and Chi and Tan (2011) propose the use of reinsurance models that minimize VaR or conditional value at risk (CVaR). Cummins and Mahul (2004), Kaluszka and Okolewski (2008), and Gajek and Zagrodny (2004a) show various ways in which a limited stop-loss treaty is optimal, while Gajek and Zagrodny (2004b), Kaluszka (2005), Kaluszka and Okolewski (2008), and Bernard and Tian (2009) show how a truncated stop loss can be viewed as optimal. Zanotto and Clemente (2022) developed a simulation-based framework with restrictions and strategies to consider multiple objectives.
This paper differs from prior works by providing methods that are more understandable to a wider audience within insurance organizations. These methods are more analogous to those used to measure investment performance (Grinold and Kahn 2000) and to construct optimal portfolios (Markowitz 1952).
1.2. Objective
This paper’s objective is to explain how to optimize reinsurance from the cedant’s perspective, using terminology and performance metrics that are more accessible to a broad range of stakeholders. By adopting metrics that are familiar across an organization, this approach aims to increase organizational comprehension, align multiple objectives of reinsurance purchasing, and improve the likelihood that economically optimal structures will be recognized and utilized in practice.
The remainder of the paper proceeds as follows. Section 2 describes the traditional risk-free margin (TRFM) and alternative risk-free margin (ARFM) formulas, providing intuitive examples that include quota shares and structures without a ceding commission. In Section 3, the ratio within the ARFM formula is isolated and used as a risk-adjusted performance score that can be compared to a standard quota share with zero risk-free margin. Section 4 describes additional benefits and limitations of both the ARFM and the risk-adjusted performance metric. Section 5 concludes the paper.
2. The traditional and alternative risk-free margin formulas
The TRFM formula is simply the ceding commission less the subject business’s expense ratio. It is margin that the cedant receives “risk-free” for writing the business and ceding to a reinsurer. For example, if a cedant has a 28% expense ratio and purchases a quota share with a 30% ceding commission, the cedant receives 2% (30% of ceding commission from the reinsurer less 28% of expenses to write the business) of ceded premium regardless of the loss ratio on that ceded business. This metric is commonly used because its calculation and benefits are so clearly understood. A positive risk-free margin provides expense relief above the costs of writing the business and communicates to management that one or more reinsurers are willing to accept the same risk at a higher cost. In other words, reinsurers provide a vote of confidence in the underwriting.
The ARFM formula is equivalent to subtracting the expenses from the ceding commission, barring exceptions to be described later. It is defined as
ARFM=(1−⌊ΔMarginΔσ⌋)∗gross margin
where
ΔMargin=Ceded MarginGross Margin
and
Δσ=σ(Gross)−σ(Net)σ(Gross).
The gross margin is the amount of profit available after subtracting gross losses and expenses, while the ceded margin is the amount of profit ceded to the reinsurer after subtracting the ceding commission and expected recoveries due to the cedant. Any internal expenses that the reinsurer incurs are not considered because these calculations are from the perspective of the cedant. The gross standard deviation is simply the total variation in expected losses before application of the reinsurance being measured, and the change in standard deviation is the reduction in loss variability after the application of reinsurance.
Estimates of gross margin and gross standard deviation will vary by analyst and methodology. The estimation method is outside the scope of this paper, but once these metrics are established, the corresponding ceded and net amounts under a quota share without risk-limiting features—referred to here as a “standard” quota share—are mechanically determined. The percent change in standard deviation is equal to the cession percentage because losses are ceded proportionally, and the percent change in margin is driven by the difference between the ceding commission and the expense ratio.
When Δσ is greater than ΔMargin, then the reinsurance agreement is ceding a greater percentage of risk (standard deviation) than percentage of margin, is less than 1, and there is a positive risk-free margin. If Δσ is less than ΔMargin, then the reverse is true: The reinsurance agreement is ceding a smaller percentage of risk than percentage of margin, is greater than 1, and, if the agreement has a ceding commission, the cedant is not receiving enough to cover the cost of writing the business.
2.1. Initial examples
To provide some intuitive examples, when a cedant purchases a 40.0% quota share with a ceding commission equal to the expense ratio, the cedant cedes 40.0% of both the margin and the standard deviation to the reinsurer. Table 1 shows the impact of such a quota share on a portfolio with a 65.0% expected loss ratio, a 30.0% expense ratio, and a $100 standard deviation. These metrics result in a risk-free margin equal to 0.0%, as shown in Table 1.
The only way for a quota share to cede both 40.0% of the margin and 40.0% of the standard deviation is to have a 40.0% cession with the ceding commission equal to the expense ratio. If a smaller share of margin is ceded compared to the standard deviation in a quota share, then the ceding commission must be higher than the expense ratio, leading to a positive risk-free margin, and vice versa.
If the ceding commission increases to 32.5% from the original 30.0%, the expected ceded margin reduces from 5.0% to 2.5% (ceded margin / ceded premium), and the cedant cedes only 20.0% of the gross margin while still ceding 40.0% of the gross standard deviation. With the knowledge that only 20.0% of the gross margin is ceded relative to 40.0% of the gross standard deviation, one can infer that the risk-free margin must be half of the gross margin. As shown in Equation (3) and Table 2, the ARFM calculates this without reference to the ceding commission or the expense ratio:
TRFM=32.5%−30.0%=2.5%
ARFM=(1−⌊20.0%40.0%⌋)∗5.0%=2.5%
2.2. Examples of the ARFM applied to alternative structures
The following examples use the ARFM to compare the quota share shown in Table 2 with (1) a quota share incorporating risk-mitigating features and (2) two excess of loss (XOL) structures. Risk-mitigating features in the quota share may include, for example, a loss ratio cap—under which the reinsurer’s loss ratio is limited to a certain threshold and losses above that threshold revert to the cedant—or a loss corridor, whereby losses within a defined range are retained net to the cedant. Such features are commonly introduced to improve economic terms, lowering the cost of reinsurance in exchange for a reduction in the amount of risk ceded. The specific mechanism is not material to the example; rather, the key characteristic is that such features reduce the standard deviation relative to a standard quota share.
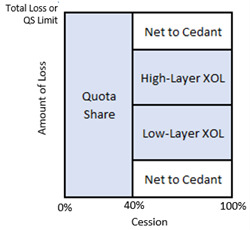
The XOL structures are designated “Low-Layer XOL” and “High-Layer XOL.” Each XOL is assumed to have a 60% cession and to provide reinsurance protection alongside the quota share, reflecting a common approach to layering multiple reinsurance structures. These arrangements are illustrated in Figure 1.
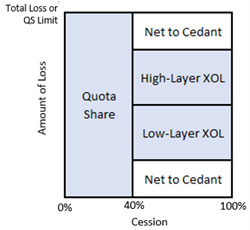
XOL reinsurance typically does not include a ceding commission and provides recoveries only for losses exceeding the XOL’s retention, subject to a specified limit. A rate is applied to the subject premium to reflect the expected recoveries and a reinsurer margin. This rate is multiplied by the cession to reflect the share that reinsurers are accepting to determine the ceded premium.
For reinsurance structures that are not standard quota shares, the reinsurer’s standard deviation of the ceded exposure will not generally equal the difference between the gross and net standard deviations. This is because the variance, and therefore the standard deviation, is dependent on the covariance between the gross and ceded losses, and the relationship is not perfectly linear as it is under a standard quota share. Accordingly, the ceded standard deviation is defined as the change between gross and net standard deviation, which directly reflects the reduction in volatility experienced by the cedant. The premium, expected loss, and standard deviations for the XOLs have been created for illustrative purposes and are compared to the quota share in Table 3.
The inclusion of risk-mitigating features in the quota share reduces the standard deviation from $40 to $35. While the TRFM remains unchanged at 2.5%, the ARFM declines to 2.1%. The ARFM therefore indicates that, to achieve the same ratio of ceded risk to ceded margin under a standard quota share, the ceding commission would only be 2.1% above expenses, corresponding to an “implied ceding commission” of 32.1%. Stated differently, the risk-mitigating features are equivalent to 0.4% of the ceding commission (2.5% less 2.1%).
In practice, reinsurers may hold views of loss volatility that differ from those of the cedant. As a result, exchanging a higher ceding commission for the inclusion of risk-mitigating features may be economically preferable to both parties relative to a standard quota share.
The Low-Layer XOL cedes slightly more standard deviation but only half the margin of the quota share. A standard quota share with the same ratio would have a risk-free margin of 3.8% or a ceding commission of 33.8%.
While an implied ceding commission does not provide the same benefit to financials—the 40.0% quota share improves the cedant’s combined ratio by 1.7%, while the XOL deteriorates it by 0.4%—it does show the greater risk-transfer benefits of the XOL in a familiar and easily understood metric.
The High-Layer XOL differs by ceding a greater share of margin than standard deviation, although both amounts are smaller in dollar terms when compared to the other treaties. Its implied ceding commission is 21.7%, well below the gross expense ratio.
3. The risk-adjusted performance score within the ARFM
The ratio of percentage of margin ceded over percentage of standard deviation ceded within the ARFM can be used as a risk-adjusted performance score that is analogous to the information ratio (Grinold and Kahn 2000). The information ratio divides the difference between a portfolio’s return and a benchmark’s return (excess return) by the difference between a portfolio’s standard deviation and a benchmark’s standard deviation (tracking error). It is a common metric with uses including the evaluation of active investment performance, the comparison of investment strategies, and the construction of optimal portfolios.
Information Ratio=RP−RBσP− σB
The greater the excess return relative to tracking error, the higher the information ratio. This paper evaluates reinsurance from a cedant’s perspective, so the greater the volatility ceded relative to the ceded return, the better (for the cedant). Consequently, this paper will use the inverse of the ratio to calculate a risk-adjusted performance score that allows for a positive risk-free margin to be identifiable by a value greater than 1. While the information ratio is well established, its use in evaluating reinsurance can promote greater organizational clarity because a value of 1 provides a useful anchor—a standard quota share with a ceding commission equal to expenses.
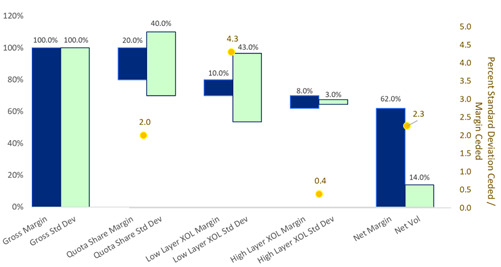
Figure 2 shows the percentages of margin and standard deviation ceded for the standard quota share and two XOL structures from Table 3, along with their corresponding risk-adjusted performance scores. These scores may be compared to one another; to all the reinsurance on a combined basis; and to a value of 1, which corresponds to a standard quota share with a ceding commission equal to expenses.
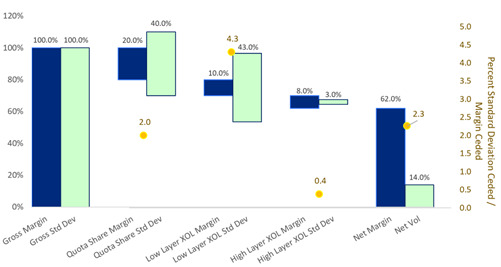
It is clear from that the Low-Layer XOL cedes the greatest level of risk relative to the margin. Its score is 4.3, compared to the quota share’s and the High-Layer XOL’s scores of 2.0 and 0.4, respectively. From these figures, a cedant might conclude that increasing the XOL cession and reducing the quota share would improve the overall risk-return ratio, but doing so may require an equivalent cession for both the Low-Layer XOL and High-Layer XOL due to market appetite (i.e., reinsurance markets will write the Low-Layer XOL only if they can write the same cession on the High-Layer XOL).
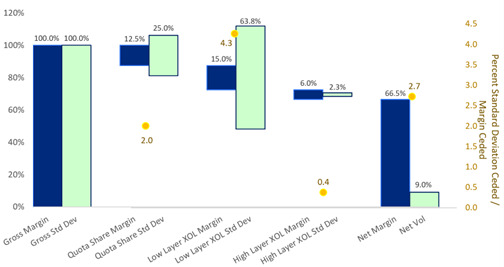
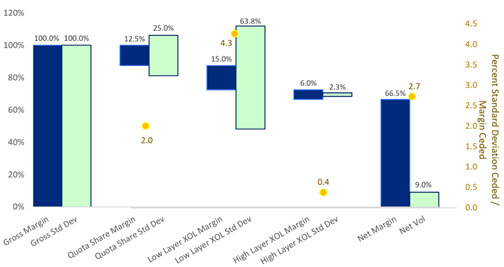
The ARFM or risk-adjusted performance score can be applied not only to individual treaties with different structures but also to multiple treaties across a portfolio. The score across all three reinsurance structures shows the overall impact of all treaties and how much better or worse the treaties perform from a risk-return perspective compared to a standard quota share with a score of 1. The treaties in Figure 2 provide a total score of 2.3, while Figure 3 shows the impact of reducing the quota share cession to 25% and increasing the XOL cession to 75%.
While the percentages of ceded margin and standard deviation have changed under the new cessions, their risk-adjusted performance scores have not, which is expected since the ratios would stay the same. In practice, increasing the XOL cessions may require a higher price to increase reinsurer interest. This would, in turn, lower their scores. The overall score has changed because of the different cessions, and it is clear in this example that although the High-Layer XOL dampens the benefit of changing the cessions, the 2.7 overall score shows that there is still better risk-return pricing under the cessions illustrated in Figure 3 than under those depicted in Figure 2.
4. Additional benefits and limitations of the ARFM and risk-adjusted performance score
4.1. Reinsurance structures with zero margin or standard deviation ceded
As with the information ratio, the ARFM and risk-adjusted performance score are only meaningful when the ceded margin and ceded standard deviation are nonzero. When the ceded margin is zero, the ARFM reduces to the gross margin and is invariant to the amount of standard deviation ceded, implying that the metric cannot distinguish between reinsurance structures that differ only in the degree of risk transfer. When the ceded standard deviation is zero, the ratios are mathematically undefined due to a zero denominator. Such treaties are devoid of any effective risk transfer and are not economically realistic.
4.2. Absolute value of reinsurance versus relative value
The metrics discussed in this paper measure the benefits of reinsurance structures relative to other structures either individually or in aggregate. They also provide a comparison to a common reference, a standard quota share with a ceding commission that matches expenses. This comparison does not identify how much risk an organization should cede relative to the amount of margin. Such a calculation would require capital, regulatory, and earnings considerations that are beyond the scope of this paper.
4.3. Standard deviation versus other tail-risk metrics
This paper uses standard deviation for its measure of risk in reinsurance treaties, which may not accurately capture the benefits of protection against low-frequency, high-severity events. Treaties with similar standard deviations may have meaningfully different impacts on factors such as capital requirements, solvency ratios, or extreme loss outcomes. Tail-risk metrics such as VaR and CVaR provide a more direct assessment of protection at the tail of a loss distribution. While certain reinsurance is purchased primarily to improve capital or solvency ratios, this paper’s focus has been on developing more accessible metrics for treaties purchased at the individual portfolio level, independent of the capital model.
With this in mind, the risk-adjusted performance score could be extended by applying a scaling factor to the percent change in standard deviation for treaties where tail protection is the primary objective. Under this approach, the volatility reduction term would be adjusted by a constant (k) reflecting the relative importance assigned to tail-risk mitigation.
Risk-Adjusted Performance Score with Scaling Factor=(⌊Δσ∗kΔMargin⌋)
While such an adjustment may better reflect the economic value of tail protection, it introduces judgment that may reduce comparability and wider understanding across the organization.
4.4. Reinsurance on subsets of diversified books of business
To this point, the standard deviation used has been its value at the subject business level. This is often how reinsurance is evaluated when the goal of purchasing is not to influence capital requirements but to manage risk within individual underwriting portfolios. In practice, however, a treaty often covers only a subset of a cedant’s overall book of business, and that subset’s contribution to overall volatility may be materially different once its impact on the diversification of the rest of the portfolio is considered. Reinsurance affects not only the variability of the ceded business but also its covariance with the remainder of the underwriting portfolio, a distinction that is central to modern portfolio theory (Markowitz 1952). While a subject business’s standard deviation is relevant for line-of-business decision-making, all stakeholders invested in the company’s success should consider reinsurance’s impact on the overall portfolio. An ARFM that is lower because of the impact of diversification provides pertinent information about how well the subject business diversifies the overall portfolio and how effectively a treaty contributes to enterprise risk management.
5. Conclusion
Reinsurance affects an organization across multiple dimensions—including capital requirements, earnings volatility, and expected profitability—and is therefore evaluated through a variety of lenses. Yet internal discussions are often constrained by the differing technical backgrounds of stakeholders and the limitations of tools used at the individual portfolio level. The measures developed in this paper—the ARFM, the implied ceding commission, and the risk-adjusted performance score—seek to bridge this gap by offering tools that capture risk-return metrics while remaining intuitive and broadly interpretable.
Both the ARFM and the implied ceding commission highlight the trade-off between ceded margin and ceded risk in a manner familiar to stakeholders purchasing reinsurance across an organization, enabling meaningful comparisons across treaty structures with and without risk-mitigating features or explicit ceding commissions. The risk-adjusted performance score reduces treaty comparisons to the percentages of margin and standard deviation ceded while anchoring the analysis to the familiar case of a standard quota share with a ceding commission equal to expenses.
Taken together, these measures enhance organizational clarity, support more aligned decision-making among stakeholders, and help underwriting teams identify economically favorable structures that might otherwise be overlooked due to reliance on simplified metrics. Although determining the optimal level of reinsurance requires broader consideration of capital, regulatory, and earnings objectives, the tools presented here provide a unified and interpretable framework for comparing alternatives and improving the transparency of internal reinsurance discussions.